Initial Ozone Exceedance Analysis for July 27, 2026
Monitors Exceeding Ozone Concentration of 70 ppb
| Monitor AQS ID | Site Name | Location (Lat, Long) | Ozone Value | AQI Category |
|---|---|---|---|---|
| 060714003 | Redlands - Dearborn | 34.06, -117.15 | 86.0 | Unhealthy |
| 060370016 | Glendora - Laurel | 34.14, -117.85 | 86.0 | Unhealthy |
| 060376012 | Santa Clarita | 34.38, -118.53 | 76.0 | Sensitive Group |
| 060658001 | Riverside - Rubidoux | 34.00, -117.42 | 75.0 | Sensitive Group |
| 060658005 | Mira Loma - Van Buren | 34.00, -117.49 | 75.0 | Sensitive Group |
| 060712002 | Fontana - Arrow Highway | 34.10, -117.49 | 77.0 | Sensitive Group |
| 060719004 | San Bernadino - 4th Street | 34.11, -117.27 | 81.0 | Sensitive Group |
| 060372005 | Pasadena | 34.13, -118.13 | 77.0 | Sensitive Group |
| 060710005 | Crestline - Lake Gregory | 34.24, -117.27 | 85.0 | Sensitive Group |
| 160230101 | Craters of the Moon NM | 43.46, -113.56 | 78.0 | Sensitive Group |
| 060710306 | Victorville - Park Avenue | 34.51, -117.33 | 83.0 | Sensitive Group |
| 060714001 | Hesperia - Olive Street | 34.42, -117.29 | 83.0 | Sensitive Group |
Air Quality Analysis
| Monitor AQS ID | Air Quality Analysis |
|---|---|
| 060714003 | Hourly Ozone Analysis At Redlands - Dearborn, hourly ozone concentrations showed no significant trend on July 27 and July 28. O3 levels exceeded 70 ppb on 15 occasions, occurring at: July 27, 10:00 AM, July 27, 11:00 AM, July 27, 12:00 PM, July 27, 01:00 PM, July 27, 02:00 PM, July 27, 03:00 PM, July 27, 04:00 PM, July 28, 10:00 AM, July 28, 11:00 AM, July 28, 12:00 PM, July 28, 01:00 PM, July 28, 02:00 PM, July 28, 03:00 PM, July 28, 04:00 PM, July 28, 05:00 PM. Among these exceedances, 3 were significant pollution spikes (peaks), recorded at: July 27, 11:00 AM, July 27, 03:00 PM, July 28, 01:00 PM. Hourly ozone levels showed a distinct day-night pattern. The highest recorded ozone concentration was 108.0 ppb at July 27, 03:00 PM, while the lowest was 12.0 ppb at July 28, 04:00 AM. Unusual ozone spikes detected at: July 27, 03:00 PM, July 28, 01:00 PM, July 28, 02:00 PM. Daily ozone Analysis of the Year Throughout 2026, ozone levels at Redlands - Dearborn exceeded 70 ppb on 57 days, which accounts for 15.6% of the year. On July 27, 2026, the ozone concentration reached 86.0 ppb, ranking #17 among exceedance events this year. The highest ozone exceedance this year was 99.0 ppb on July 09, 2026, which was 13.0 ppb higher than this event. The majority of exceedance events occurred in July, with 20 occurrences. The season with the highest exceedance frequency was Summer, accounting for 34 exceedance days. Historical daily Ozone Analysis Between 2022 and 2026, ozone levels at Redlands - Dearborn exceeded the 70 ppb daily standard most frequently during Spring, accounting for 27.6% of all exceedances. The month with the highest number of exceedances was January, making up 9.4% of the total. The exceedance recorded on July 27, 2026 at Redlands - Dearborn reached 86.0 ppb, which is 29.0 ppb higher than the average Spring ozone level of 57.0 ppb. This exceedance is notable but does not rank in the top 10 highest exceedances recorded from 2022 to 2026. These exceedances are often influenced by seasonal factors such as wildfires, prescribed burns, stagnant air, temperature inversions, or increased local emissions. |
| 060370016 | Hourly Ozone Analysis At Glendora - Laurel, hourly ozone concentrations showed no significant trend on July 27 and July 28. O3 levels exceeded 70 ppb on 14 occasions, occurring at: July 27, 11:00 AM, July 27, 12:00 PM, July 27, 01:00 PM, July 27, 02:00 PM, July 27, 03:00 PM, July 27, 04:00 PM, July 27, 05:00 PM, July 28, 11:00 AM, July 28, 12:00 PM, July 28, 01:00 PM, July 28, 02:00 PM, July 28, 03:00 PM, July 28, 04:00 PM, July 28, 05:00 PM. Among these exceedances, 4 were significant pollution spikes (peaks), recorded at: July 27, 01:00 PM, July 27, 04:00 PM, July 28, 12:00 PM, July 28, 03:00 PM. Hourly ozone levels showed a distinct day-night pattern. The highest recorded ozone concentration was 99.0 ppb at July 28, 03:00 PM, while the lowest was 15.0 ppb at July 27, 01:00 AM. Unusual ozone spikes detected at: July 27, 01:00 PM, July 28, 03:00 PM, July 28, 04:00 PM. Daily ozone Analysis of the Year Throughout 2026, ozone levels at Glendora - Laurel exceeded 70 ppb on 53 days, which accounts for 14.5% of the year. On July 27, 2026, the ozone concentration reached 86.0 ppb, ranking #7 among exceedance events this year. The highest ozone exceedance this year was 109.0 ppb on March 20, 2026, which was 23.0 ppb higher than this event. The majority of exceedance events occurred in July, with 16 occurrences. The season with the highest exceedance frequency was Spring, accounting for 26 exceedance days. Historical daily Ozone Analysis Between 2022 and 2026, ozone levels at Glendora - Laurel exceeded the 70 ppb daily standard most frequently during Spring, accounting for 26.6% of all exceedances. The month with the highest number of exceedances was March, making up 9.5% of the total. The exceedance recorded on July 27, 2026 at Glendora - Laurel reached 86.0 ppb, which is 31.6 ppb higher than the average Spring ozone level of 54.4 ppb. This exceedance is notable but does not rank in the top 10 highest exceedances recorded from 2022 to 2026. These exceedances are often influenced by seasonal factors such as wildfires, prescribed burns, stagnant air, temperature inversions, or increased local emissions. |
| 060376012 | Hourly Ozone Analysis At Santa Clarita, hourly ozone concentrations showed no significant trend on July 27 and July 28. O3 levels exceeded 70 ppb on 14 occasions, occurring at: July 27, 10:00 AM, July 27, 11:00 AM, July 27, 12:00 PM, July 27, 01:00 PM, July 27, 02:00 PM, July 27, 03:00 PM, July 27, 04:00 PM, July 28, 11:00 AM, July 28, 12:00 PM, July 28, 01:00 PM, July 28, 02:00 PM, July 28, 03:00 PM, July 28, 04:00 PM, July 28, 05:00 PM. Among these exceedances, 4 were significant pollution spikes (peaks), recorded at: July 27, 12:00 PM, July 27, 03:00 PM, July 28, 12:00 PM, July 28, 03:00 PM. Hourly ozone levels showed a distinct day-night pattern. The highest recorded ozone concentration was 89.0 ppb at July 27, 12:00 PM, while the lowest was 11.0 ppb at July 28, 05:00 AM. Unusual ozone spikes detected at: July 27, 12:00 PM, July 28, 12:00 PM, July 28, 03:00 PM. Daily ozone Analysis of the Year Throughout 2026, ozone levels at Santa Clarita exceeded 70 ppb on 35 days, which accounts for 9.6% of the year. On July 27, 2026, the ozone concentration reached 76.0 ppb, ranking #19 among exceedance events this year. The highest ozone exceedance this year was 89.0 ppb on July 09, 2026, which was 13.0 ppb higher than this event. The majority of exceedance events occurred in July, with 12 occurrences. The season with the highest exceedance frequency was Summer, accounting for 20 exceedance days. Historical daily Ozone Analysis Between 2022 and 2026, ozone levels at Santa Clarita exceeded the 70 ppb daily standard most frequently during Spring, accounting for 27.7% of all exceedances. The month with the highest number of exceedances was May, making up 9.5% of the total. The exceedance recorded on July 27, 2026 at Santa Clarita reached 76.0 ppb, which is 21.4 ppb higher than the average Spring ozone level of 54.6 ppb. This exceedance is notable but does not rank in the top 10 highest exceedances recorded from 2022 to 2026. These exceedances are often influenced by seasonal factors such as wildfires, prescribed burns, stagnant air, temperature inversions, or increased local emissions. |
| 060658001 | Hourly Ozone Analysis At Riverside - Rubidoux, hourly ozone concentrations showed no significant trend on July 27 and July 28. O3 levels exceeded 70 ppb on 10 occasions, occurring at: July 27, 10:00 AM, July 27, 11:00 AM, July 27, 12:00 PM, July 27, 01:00 PM, July 27, 02:00 PM, July 28, 10:00 AM, July 28, 11:00 AM, July 28, 12:00 PM, July 28, 01:00 PM, July 28, 02:00 PM. Among these exceedances, 2 were significant pollution spikes (peaks), recorded at: July 27, 01:00 PM, July 28, 12:00 PM. Hourly ozone levels showed a distinct day-night pattern. The highest recorded ozone concentration was 101.0 ppb at July 27, 01:00 PM, while the lowest was 9.0 ppb at July 27, 05:00 AM. Unusual ozone spikes detected at: July 27, 01:00 PM, July 28, 12:00 PM, July 28, 01:00 PM. Daily ozone Analysis of the Year Throughout 2026, ozone levels at Riverside - Rubidoux exceeded 70 ppb on 43 days, which accounts for 11.8% of the year. On July 27, 2026, the ozone concentration reached 75.0 ppb, ranking #21 among exceedance events this year. The highest ozone exceedance this year was 101.0 ppb on March 20, 2026, which was 26.0 ppb higher than this event. The majority of exceedance events occurred in July, with 15 occurrences. The season with the highest exceedance frequency was Summer, accounting for 23 exceedance days. Historical daily Ozone Analysis Between 2022 and 2026, ozone levels at Riverside - Rubidoux exceeded the 70 ppb daily standard most frequently during Spring, accounting for 27.7% of all exceedances. The month with the highest number of exceedances was July, making up 9.4% of the total. The exceedance recorded on July 27, 2026 at Riverside - Rubidoux reached 75.0 ppb, which is 19.9 ppb higher than the average Spring ozone level of 55.1 ppb. This exceedance is notable but does not rank in the top 10 highest exceedances recorded from 2022 to 2026. These exceedances are often influenced by seasonal factors such as wildfires, prescribed burns, stagnant air, temperature inversions, or increased local emissions. |
| 060658005 | Hourly Ozone Analysis At Mira Loma - Van Buren, hourly ozone concentrations showed no significant trend on July 27 and July 28. O3 levels exceeded 70 ppb on 10 occasions, occurring at: July 27, 10:00 AM, July 27, 11:00 AM, July 27, 12:00 PM, July 27, 01:00 PM, July 27, 02:00 PM, July 28, 10:00 AM, July 28, 11:00 AM, July 28, 12:00 PM, July 28, 01:00 PM, July 28, 02:00 PM. Among these exceedances, 2 were significant pollution spikes (peaks), recorded at: July 27, 12:00 PM, July 28, 12:00 PM. Hourly ozone levels showed a distinct day-night pattern. The highest recorded ozone concentration was 93.0 ppb at July 27, 12:00 PM, while the lowest was 11.0 ppb at July 27, 05:00 AM. Unusual ozone spikes detected at: July 27, 12:00 PM, July 27, 01:00 PM, July 28, 12:00 PM. Daily ozone Analysis of the Year Throughout 2026, ozone levels at Mira Loma - Van Buren exceeded 70 ppb on 38 days, which accounts for 10.4% of the year. On July 27, 2026, the ozone concentration reached 75.0 ppb, ranking #19 among exceedance events this year. The highest ozone exceedance this year was 99.0 ppb on March 20, 2026, which was 24.0 ppb higher than this event. The majority of exceedance events occurred in July, with 14 occurrences. The season with the highest exceedance frequency was Summer, accounting for 19 exceedance days. Historical daily Ozone Analysis Between 2022 and 2026, ozone levels at Mira Loma - Van Buren exceeded the 70 ppb daily standard most frequently during Spring, accounting for 27.4% of all exceedances. The month with the highest number of exceedances was May, making up 9.4% of the total. The exceedance recorded on July 27, 2026 at Mira Loma - Van Buren reached 75.0 ppb, which is 20.4 ppb higher than the average Spring ozone level of 54.6 ppb. This exceedance is notable but does not rank in the top 10 highest exceedances recorded from 2022 to 2026. These exceedances are often influenced by seasonal factors such as wildfires, prescribed burns, stagnant air, temperature inversions, or increased local emissions. |
| 060712002 | Hourly Ozone Analysis At Fontana - Arrow Highway, hourly ozone concentrations showed no significant trend on July 27 and July 28. O3 levels exceeded 70 ppb on 12 occasions, occurring at: July 27, 11:00 AM, July 27, 12:00 PM, July 27, 01:00 PM, July 27, 02:00 PM, July 27, 03:00 PM, July 28, 11:00 AM, July 28, 12:00 PM, July 28, 01:00 PM, July 28, 02:00 PM, July 28, 03:00 PM, July 28, 04:00 PM, July 28, 05:00 PM. Among these exceedances, 3 were significant pollution spikes (peaks), recorded at: July 27, 01:00 PM, July 28, 01:00 PM, July 28, 05:00 PM. Hourly ozone levels showed a distinct day-night pattern. The highest recorded ozone concentration was 99.0 ppb at July 27, 01:00 PM, while the lowest was 1.0 ppb at July 27, 04:00 AM. Unusual ozone spikes detected at: July 27, 01:00 PM, July 27, 02:00 PM, July 28, 01:00 PM. Daily ozone Analysis of the Year Throughout 2026, ozone levels at Fontana - Arrow Highway exceeded 70 ppb on 47 days, which accounts for 12.9% of the year. On July 27, 2026, the ozone concentration reached 77.0 ppb, ranking #22 among exceedance events this year. The highest ozone exceedance this year was 106.0 ppb on March 20, 2026, which was 29.0 ppb higher than this event. The majority of exceedance events occurred in July, with 16 occurrences. The season with the highest exceedance frequency was Summer, accounting for 27 exceedance days. Historical daily Ozone Analysis Between 2022 and 2026, ozone levels at Fontana - Arrow Highway exceeded the 70 ppb daily standard most frequently during Spring, accounting for 27.9% of all exceedances. The month with the highest number of exceedances was May, making up 9.5% of the total. The exceedance recorded on July 27, 2026 at Fontana - Arrow Highway reached 77.0 ppb, which is 23.7 ppb higher than the average Spring ozone level of 53.3 ppb. This exceedance is notable but does not rank in the top 10 highest exceedances recorded from 2022 to 2026. These exceedances are often influenced by seasonal factors such as wildfires, prescribed burns, stagnant air, temperature inversions, or increased local emissions. |
| 060719004 | Hourly Ozone Analysis At San Bernadino - 4th Street, hourly ozone concentrations showed no significant trend on July 27 and July 28. O3 levels exceeded 70 ppb on 14 occasions, occurring at: July 27, 11:00 AM, July 27, 12:00 PM, July 27, 01:00 PM, July 27, 02:00 PM, July 27, 03:00 PM, July 27, 04:00 PM, July 28, 10:00 AM, July 28, 11:00 AM, July 28, 12:00 PM, July 28, 01:00 PM, July 28, 02:00 PM, July 28, 03:00 PM, July 28, 04:00 PM, July 28, 05:00 PM. Among these exceedances, 2 were significant pollution spikes (peaks), recorded at: July 27, 02:00 PM, July 28, 02:00 PM. Hourly ozone levels showed a distinct day-night pattern. The highest recorded ozone concentration was 105.0 ppb at July 27, 02:00 PM, while the lowest was 5.0 ppb at July 27, 05:00 AM. Unusual ozone spikes detected at: July 27, 02:00 PM, July 28, 02:00 PM. Daily ozone Analysis of the Year Throughout 2026, ozone levels at San Bernadino - 4th Street exceeded 70 ppb on 52 days, which accounts for 14.2% of the year. On July 27, 2026, the ozone concentration reached 81.0 ppb, ranking #22 among exceedance events this year. The highest ozone exceedance this year was 106.0 ppb on March 20, 2026, which was 25.0 ppb higher than this event. The majority of exceedance events occurred in July, with 19 occurrences. The season with the highest exceedance frequency was Summer, accounting for 32 exceedance days. Historical daily Ozone Analysis Between 2022 and 2026, ozone levels at San Bernadino - 4th Street exceeded the 70 ppb daily standard most frequently during Spring, accounting for 28.2% of all exceedances. The month with the highest number of exceedances was July, making up 9.6% of the total. The exceedance recorded on July 27, 2026 at San Bernadino - 4th Street reached 81.0 ppb, which is 24.6 ppb higher than the average Spring ozone level of 56.4 ppb. This exceedance is notable but does not rank in the top 10 highest exceedances recorded from 2022 to 2026. These exceedances are often influenced by seasonal factors such as wildfires, prescribed burns, stagnant air, temperature inversions, or increased local emissions. |
| 060372005 | Hourly Ozone Analysis At Pasadena, hourly ozone concentrations showed no significant trend on July 27 and July 28. O3 levels exceeded 70 ppb on 10 occasions, occurring at: July 27, 11:00 AM, July 27, 12:00 PM, July 27, 01:00 PM, July 27, 02:00 PM, July 27, 03:00 PM, July 28, 11:00 AM, July 28, 12:00 PM, July 28, 01:00 PM, July 28, 02:00 PM, July 28, 03:00 PM. Among these exceedances, 2 were significant pollution spikes (peaks), recorded at: July 27, 12:00 PM, July 28, 01:00 PM. Hourly ozone levels showed a distinct day-night pattern. The highest recorded ozone concentration was 92.0 ppb at July 27, 12:00 PM, while the lowest was 5.0 ppb at July 28, 05:00 AM. Unusual ozone spikes detected at: July 27, 12:00 PM, July 27, 01:00 PM, July 27, 02:00 PM. Daily ozone Analysis of the Year Throughout 2026, ozone levels at Pasadena exceeded 70 ppb on 27 days, which accounts for 7.4% of the year. On July 27, 2026, the ozone concentration reached 77.0 ppb, ranking #8 among exceedance events this year. The highest ozone exceedance this year was 101.0 ppb on March 19, 2026, which was 24.0 ppb higher than this event. The majority of exceedance events occurred in March, with 10 occurrences. The season with the highest exceedance frequency was Spring, accounting for 15 exceedance days. Historical daily Ozone Analysis Between 2022 and 2026, ozone levels at Pasadena exceeded the 70 ppb daily standard most frequently during Spring, accounting for 27.8% of all exceedances. The month with the highest number of exceedances was May, making up 9.4% of the total. The exceedance recorded on July 27, 2026 at Pasadena reached 77.0 ppb, which is 26.8 ppb higher than the average Spring ozone level of 50.2 ppb. This exceedance is notable but does not rank in the top 10 highest exceedances recorded from 2022 to 2026. These exceedances are often influenced by seasonal factors such as wildfires, prescribed burns, stagnant air, temperature inversions, or increased local emissions. |
| 060710005 | Hourly Ozone Analysis At Crestline - Lake Gregory, hourly ozone concentrations showed no significant trend on July 27 and July 28. O3 levels exceeded 70 ppb on 15 occasions, occurring at: July 27, 01:00 PM, July 27, 02:00 PM, July 27, 03:00 PM, July 27, 04:00 PM, July 27, 05:00 PM, July 27, 06:00 PM, July 28, 11:00 AM, July 28, 12:00 PM, July 28, 01:00 PM, July 28, 02:00 PM, July 28, 03:00 PM, July 28, 04:00 PM, July 28, 05:00 PM, July 28, 06:00 PM, July 28, 07:00 PM. Among these exceedances, 3 were significant pollution spikes (peaks), recorded at: July 27, 03:00 PM, July 28, 03:00 PM, July 28, 07:00 PM. Hourly ozone levels showed a distinct day-night pattern. The highest recorded ozone concentration was 105.0 ppb at July 27, 03:00 PM, while the lowest was 53.0 ppb at July 27, 08:00 AM. Unusual ozone spikes detected at: July 27, 02:00 PM, July 27, 03:00 PM, July 28, 03:00 PM. Daily ozone Analysis of the Year Throughout 2026, ozone levels at Crestline - Lake Gregory exceeded 70 ppb on 65 days, which accounts for 17.8% of the year. On July 27, 2026, the ozone concentration reached 85.0 ppb, ranking #19 among exceedance events this year. The highest ozone exceedance this year was 98.0 ppb on July 15, 2026, which was 13.0 ppb higher than this event. The majority of exceedance events occurred in July, with 21 occurrences. The season with the highest exceedance frequency was Summer, accounting for 38 exceedance days. Historical daily Ozone Analysis Between 2022 and 2026, ozone levels at Crestline - Lake Gregory exceeded the 70 ppb daily standard most frequently during Spring, accounting for 27.8% of all exceedances. The month with the highest number of exceedances was May, making up 9.5% of the total. The exceedance recorded on July 27, 2026 at Crestline - Lake Gregory reached 85.0 ppb, which is 26.8 ppb higher than the average Spring ozone level of 58.2 ppb. This exceedance is notable but does not rank in the top 10 highest exceedances recorded from 2022 to 2026. These exceedances are often influenced by seasonal factors such as wildfires, prescribed burns, stagnant air, temperature inversions, or increased local emissions. |
| 160230101 | Hourly Ozone Analysis At Craters of the Moon NM, hourly ozone concentrations showed no significant trend on July 27 and July 28. O3 levels exceeded 70 ppb on 5 occasions, occurring at: July 27, 02:00 PM, July 27, 03:00 PM, July 27, 04:00 PM, July 27, 05:00 PM, July 27, 06:00 PM. Among these exceedances, 1 were significant pollution spikes (peaks), recorded at: July 27, 04:00 PM. Hourly ozone levels showed a distinct day-night pattern. The highest recorded ozone concentration was 94.0 ppb at July 27, 04:00 PM, while the lowest was 39.0 ppb at July 28, 12:00 PM. Unusual ozone spikes detected at: July 27, 03:00 PM, July 27, 04:00 PM, July 27, 05:00 PM. Daily ozone Analysis of the Year Throughout 2026, ozone levels at Craters of the Moon NM exceeded 70 ppb on 1 days, which accounts for 0.3% of the year. On July 27, 2026, the ozone concentration reached 78.0 ppb, ranking #1 among exceedance events this year. This event matches the highest zone exceedance recorded this year. The majority of exceedance events occurred in July, with 1 occurrences. The season with the highest exceedance frequency was Summer, accounting for 1 exceedance days. Historical daily Ozone Analysis Between 2022 and 2026, ozone levels at Craters of the Moon NM exceeded the 70 ppb daily standard most frequently during Summer, accounting for 28.4% of all exceedances. The month with the highest number of exceedances was July, making up 10.3% of the total. The exceedance recorded on July 27, 2026 at Craters of the Moon NM reached 78.0 ppb, which is 27.5 ppb higher than the average Summer ozone level of 50.5 ppb. This exceedance ranks #1 out of 1403 exceedances recorded from 2022 to 2026, placing it among the top 10 highest exceedances. These exceedances are often influenced by seasonal factors such as wildfires, prescribed burns, stagnant air, temperature inversions, or increased local emissions. |
| 060710306 | Hourly Ozone Analysis At Victorville - Park Avenue, hourly ozone concentrations showed no significant trend on July 27 and July 28. O3 levels exceeded 70 ppb on 13 occasions, occurring at: July 27, 01:00 PM, July 27, 02:00 PM, July 27, 03:00 PM, July 27, 04:00 PM, July 27, 05:00 PM, July 27, 06:00 PM, July 27, 07:00 PM, July 27, 08:00 PM, July 27, 09:00 PM, July 27, 10:00 PM, July 27, 11:00 PM, July 28, 09:00 AM, July 28, 10:00 AM. Among these exceedances, 3 were significant pollution spikes (peaks), recorded at: July 27, 03:00 PM, July 27, 05:00 PM, July 28, 10:00 AM. Hourly ozone levels showed a distinct day-night pattern. The highest recorded ozone concentration was 90.0 ppb at July 27, 05:00 PM, while the lowest was 13.0 ppb at July 28, 05:00 AM. Unusual ozone spikes detected at: July 27, 05:00 PM, July 27, 06:00 PM. Daily ozone Analysis of the Year Throughout 2026, ozone levels at Victorville - Park Avenue exceeded 70 ppb on 23 days, which accounts for 6.3% of the year. On July 27, 2026, the ozone concentration reached 83.0 ppb, ranking #1 among exceedance events this year. This event matches the highest zone exceedance recorded this year. The majority of exceedance events occurred in May, with 7 occurrences. The season with the highest exceedance frequency was Summer, accounting for 13 exceedance days. Historical daily Ozone Analysis Between 2022 and 2026, ozone levels at Victorville - Park Avenue exceeded the 70 ppb daily standard most frequently during Spring, accounting for 27.6% of all exceedances. The month with the highest number of exceedances was May, making up 9.4% of the total. The exceedance recorded on July 27, 2026 at Victorville - Park Avenue reached 83.0 ppb, which is 26.8 ppb higher than the average Spring ozone level of 56.2 ppb. This exceedance is notable but does not rank in the top 10 highest exceedances recorded from 2022 to 2026. These exceedances are often influenced by seasonal factors such as wildfires, prescribed burns, stagnant air, temperature inversions, or increased local emissions. |
| 060714001 | Hourly Ozone Analysis At Hesperia - Olive Street, hourly ozone concentrations showed no significant trend on July 27 and July 28. O3 levels exceeded 70 ppb on 13 occasions, occurring at: July 27, 01:00 PM, July 27, 02:00 PM, July 27, 03:00 PM, July 27, 04:00 PM, July 27, 05:00 PM, July 27, 06:00 PM, July 27, 07:00 PM, July 28, 02:00 PM, July 28, 03:00 PM, July 28, 04:00 PM, July 28, 05:00 PM, July 28, 06:00 PM, July 28, 07:00 PM. Among these exceedances, 5 were significant pollution spikes (peaks), recorded at: July 27, 03:00 PM, July 27, 05:00 PM, July 28, 09:00 AM, July 28, 02:00 PM, July 28, 07:00 PM. Hourly ozone levels showed a distinct day-night pattern. The highest recorded ozone concentration was 93.0 ppb at July 27, 03:00 PM, while the lowest was 35.0 ppb at July 28, 03:00 AM. Unusual ozone spikes detected at: July 27, 03:00 PM, July 27, 04:00 PM, July 27, 05:00 PM. Daily ozone Analysis of the Year Throughout 2026, ozone levels at Hesperia - Olive Street exceeded 70 ppb on 33 days, which accounts for 9.0% of the year. On July 27, 2026, the ozone concentration reached 83.0 ppb, ranking #3 among exceedance events this year. The highest ozone exceedance this year was 84.0 ppb on June 05, 2026, which was 1.0 ppb higher than this event. The majority of exceedance events occurred in June, with 12 occurrences. The season with the highest exceedance frequency was Summer, accounting for 23 exceedance days. Historical daily Ozone Analysis Between 2022 and 2026, ozone levels at Hesperia - Olive Street exceeded the 70 ppb daily standard most frequently during Spring, accounting for 27.4% of all exceedances. The month with the highest number of exceedances was May, making up 9.4% of the total. The exceedance recorded on July 27, 2026 at Hesperia - Olive Street reached 83.0 ppb, which is 27.8 ppb higher than the average Spring ozone level of 55.2 ppb. This exceedance is notable but does not rank in the top 10 highest exceedances recorded from 2022 to 2026. These exceedances are often influenced by seasonal factors such as wildfires, prescribed burns, stagnant air, temperature inversions, or increased local emissions. |
Average Hourly Ozone for Days Around Event
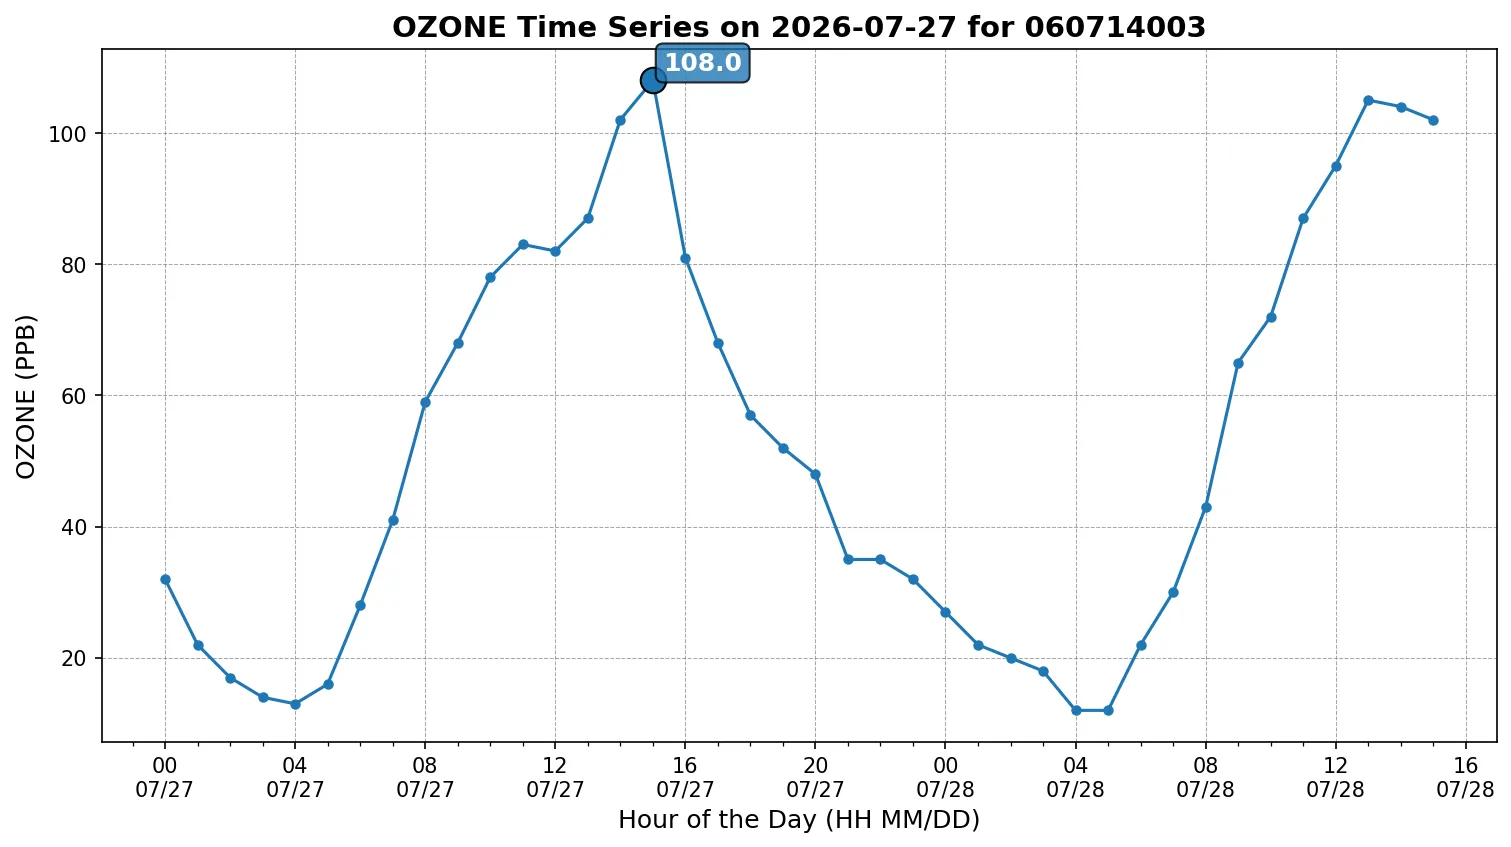
Time series of 1-hour ozone concentrations at Redlands - Dearborn starting on July 27, 2026. The number '1' indicates the highest 1-hour ozone concentration of the day, which is also the time used for HYSPLIT backward trajectory analysis.
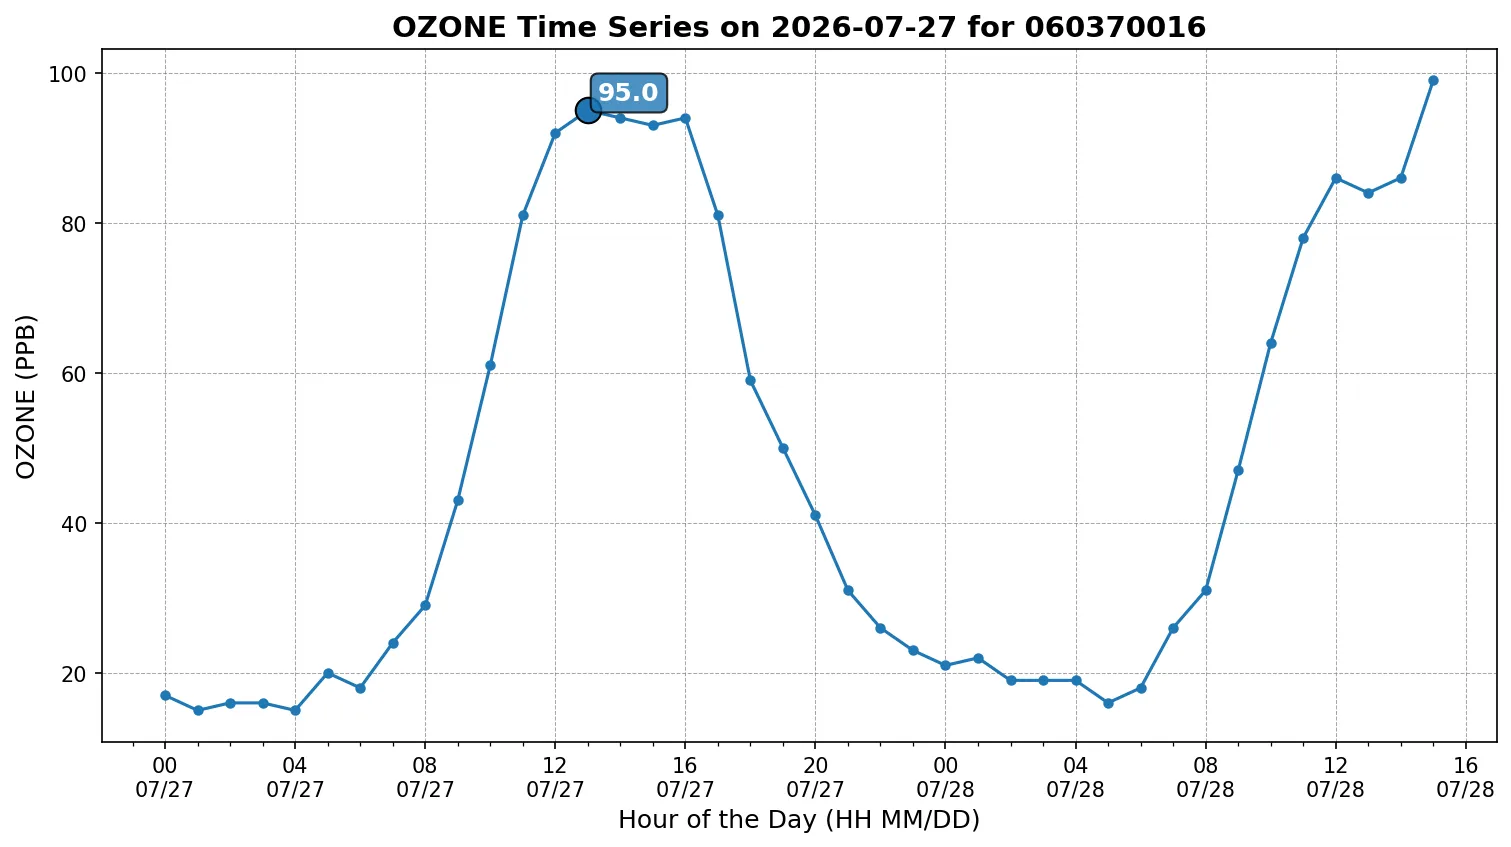
Time series of 1-hour ozone concentrations at Glendora - Laurel starting on July 27, 2026. The number '1' indicates the highest 1-hour ozone concentration of the day, which is also the time used for HYSPLIT backward trajectory analysis.
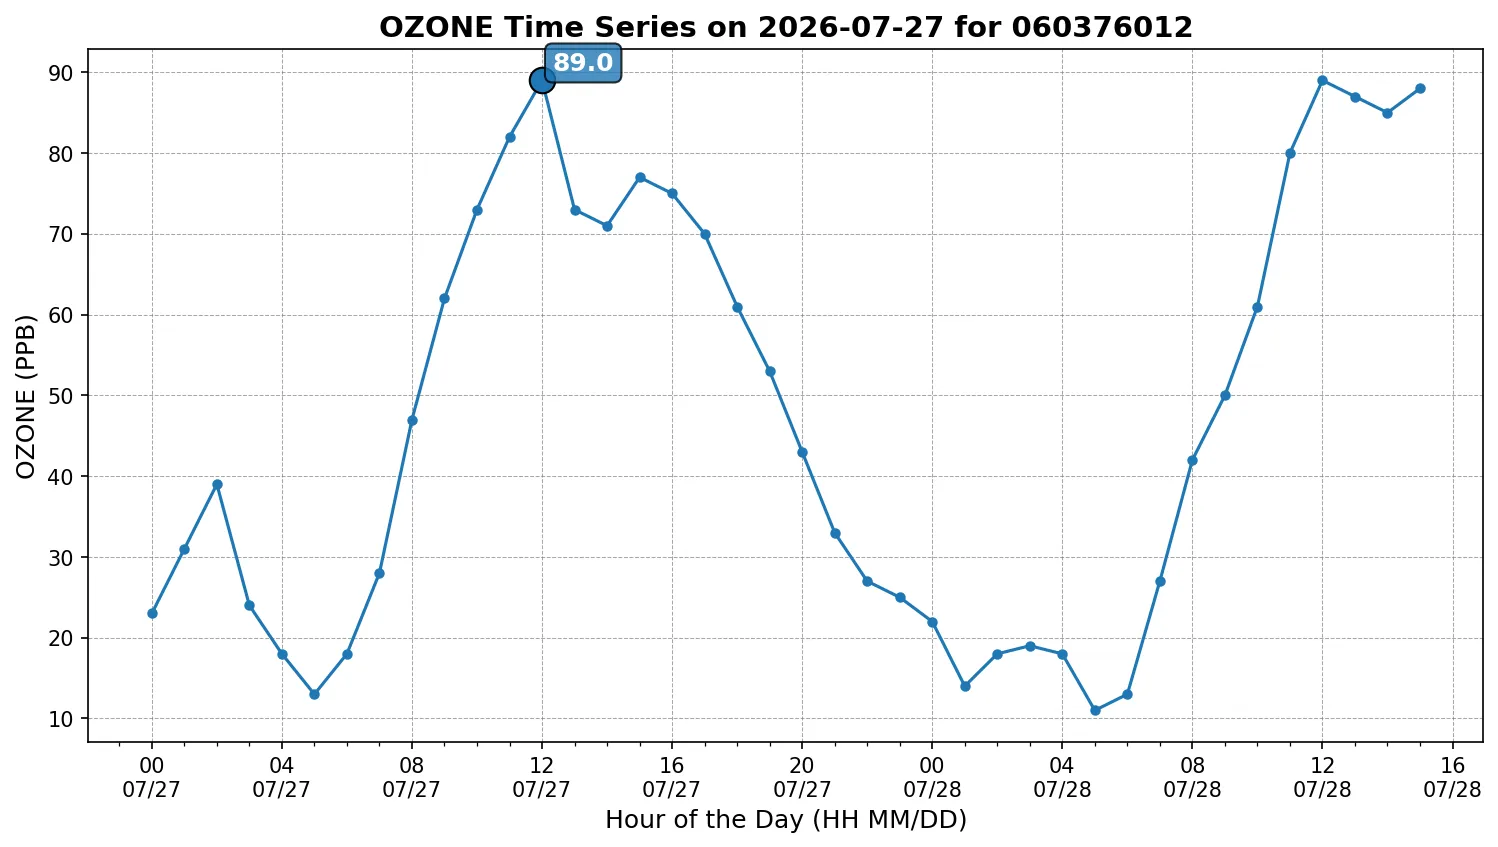
Time series of 1-hour ozone concentrations at Santa Clarita starting on July 27, 2026. The number '1' indicates the highest 1-hour ozone concentration of the day, which is also the time used for HYSPLIT backward trajectory analysis.
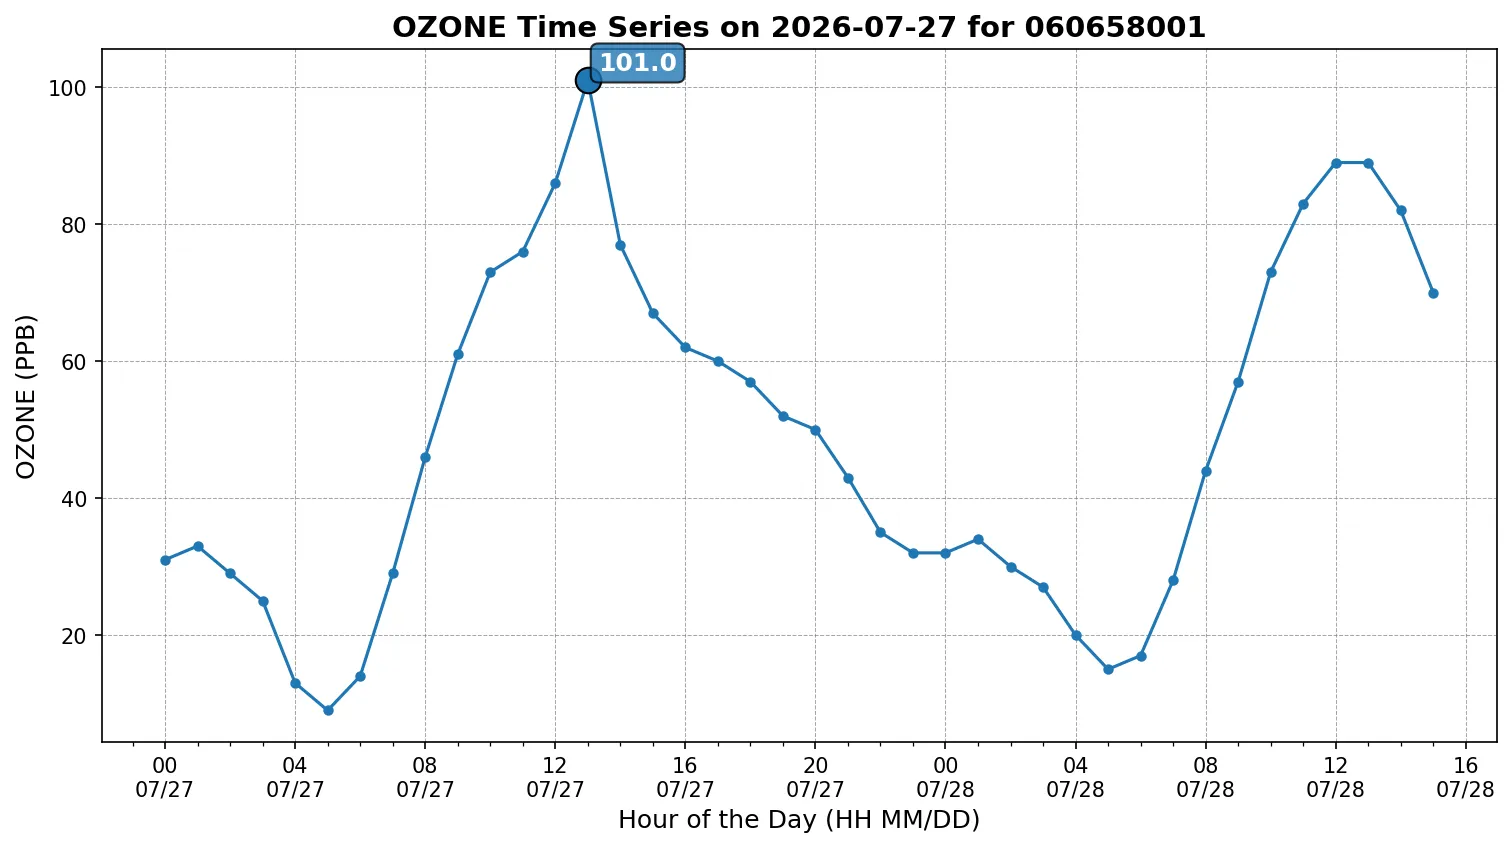
Time series of 1-hour ozone concentrations at Riverside - Rubidoux starting on July 27, 2026. The number '1' indicates the highest 1-hour ozone concentration of the day, which is also the time used for HYSPLIT backward trajectory analysis.
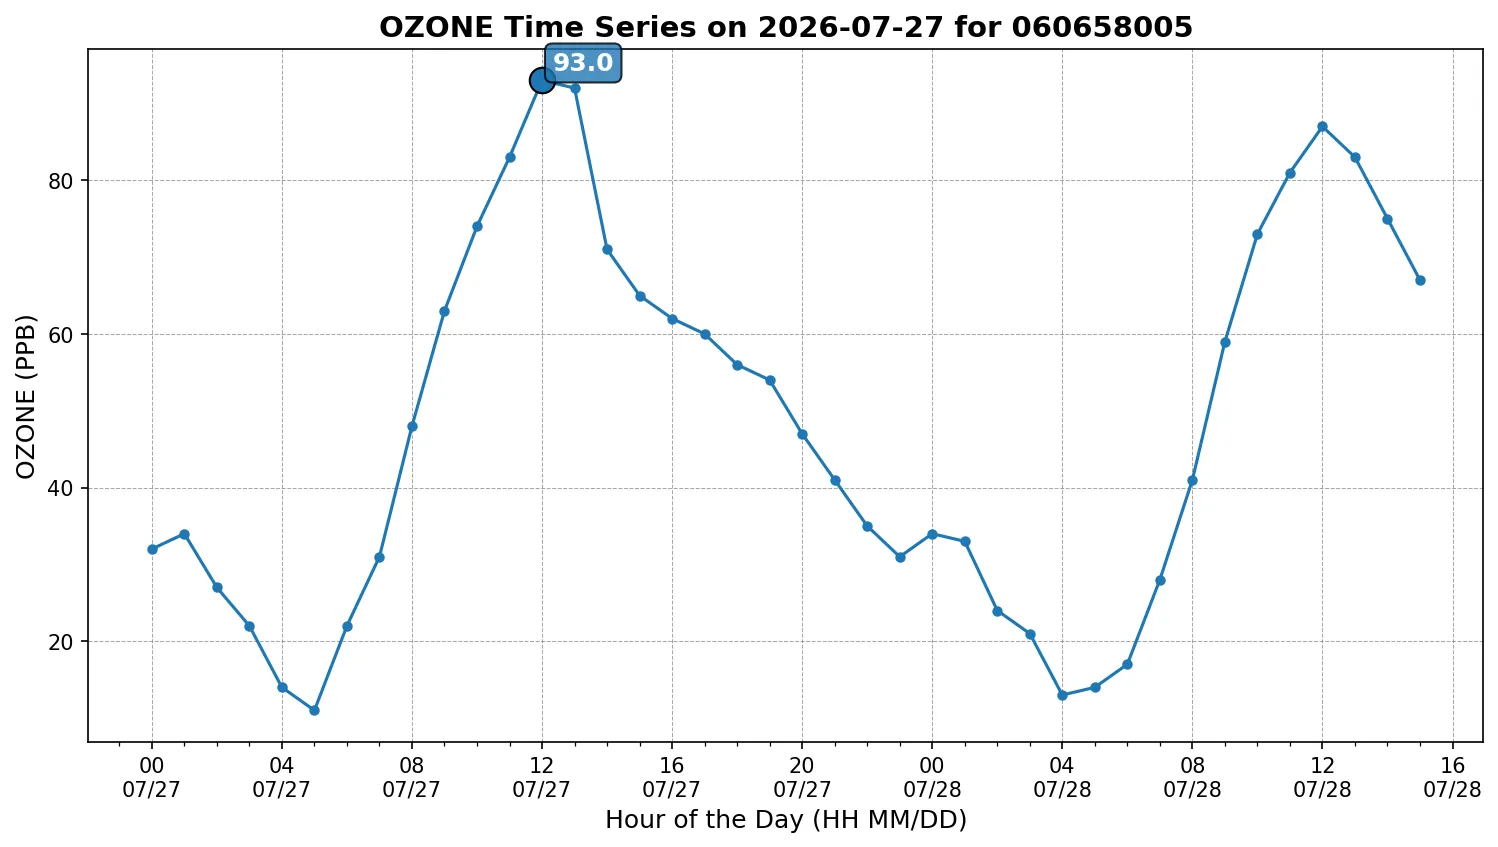
Time series of 1-hour ozone concentrations at Mira Loma - Van Buren starting on July 27, 2026. The number '1' indicates the highest 1-hour ozone concentration of the day, which is also the time used for HYSPLIT backward trajectory analysis.
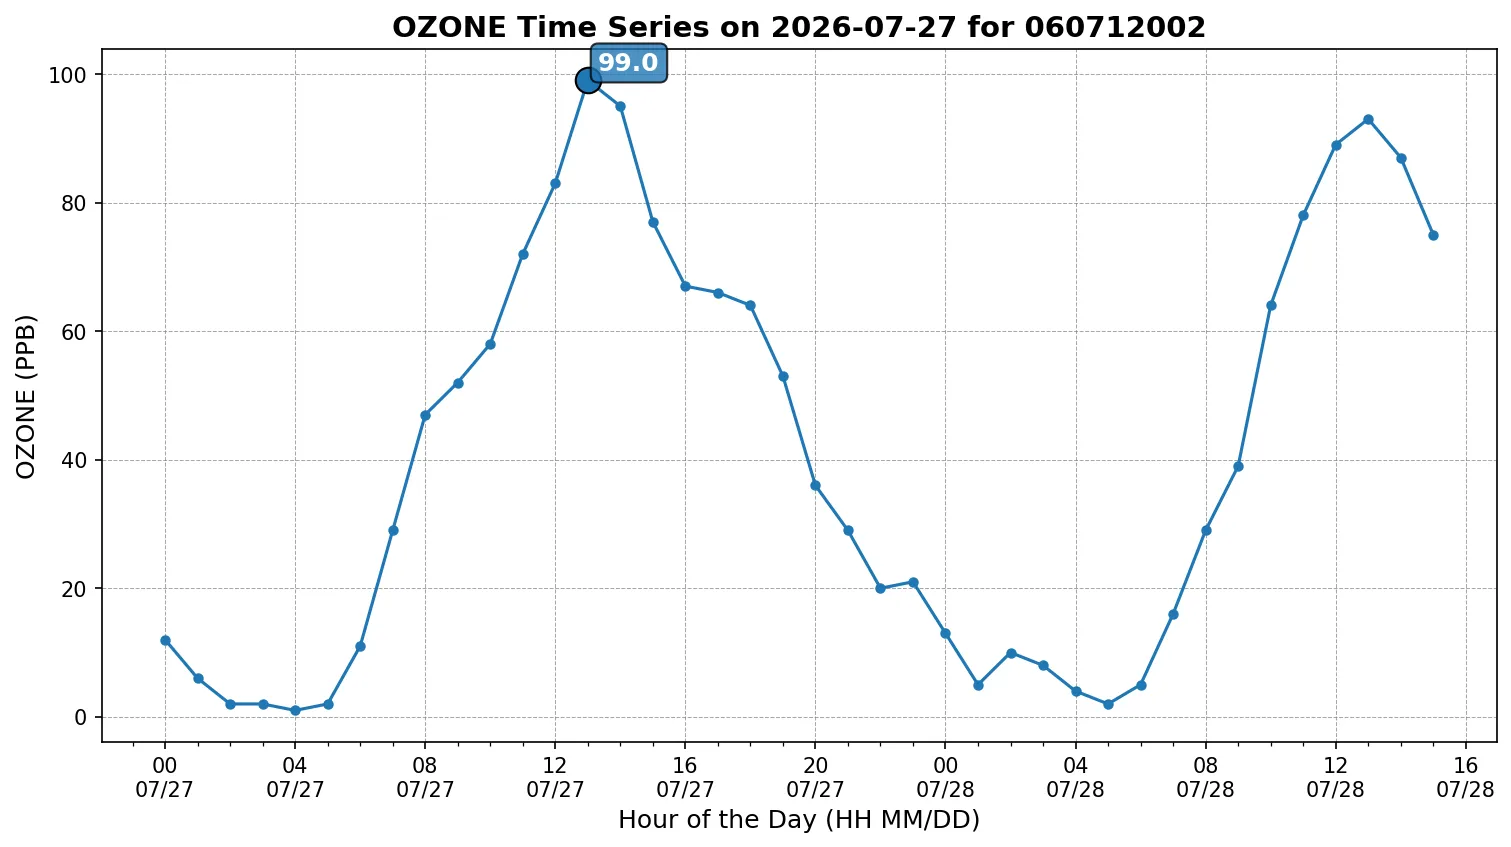
Time series of 1-hour ozone concentrations at Fontana - Arrow Highway starting on July 27, 2026. The number '1' indicates the highest 1-hour ozone concentration of the day, which is also the time used for HYSPLIT backward trajectory analysis.
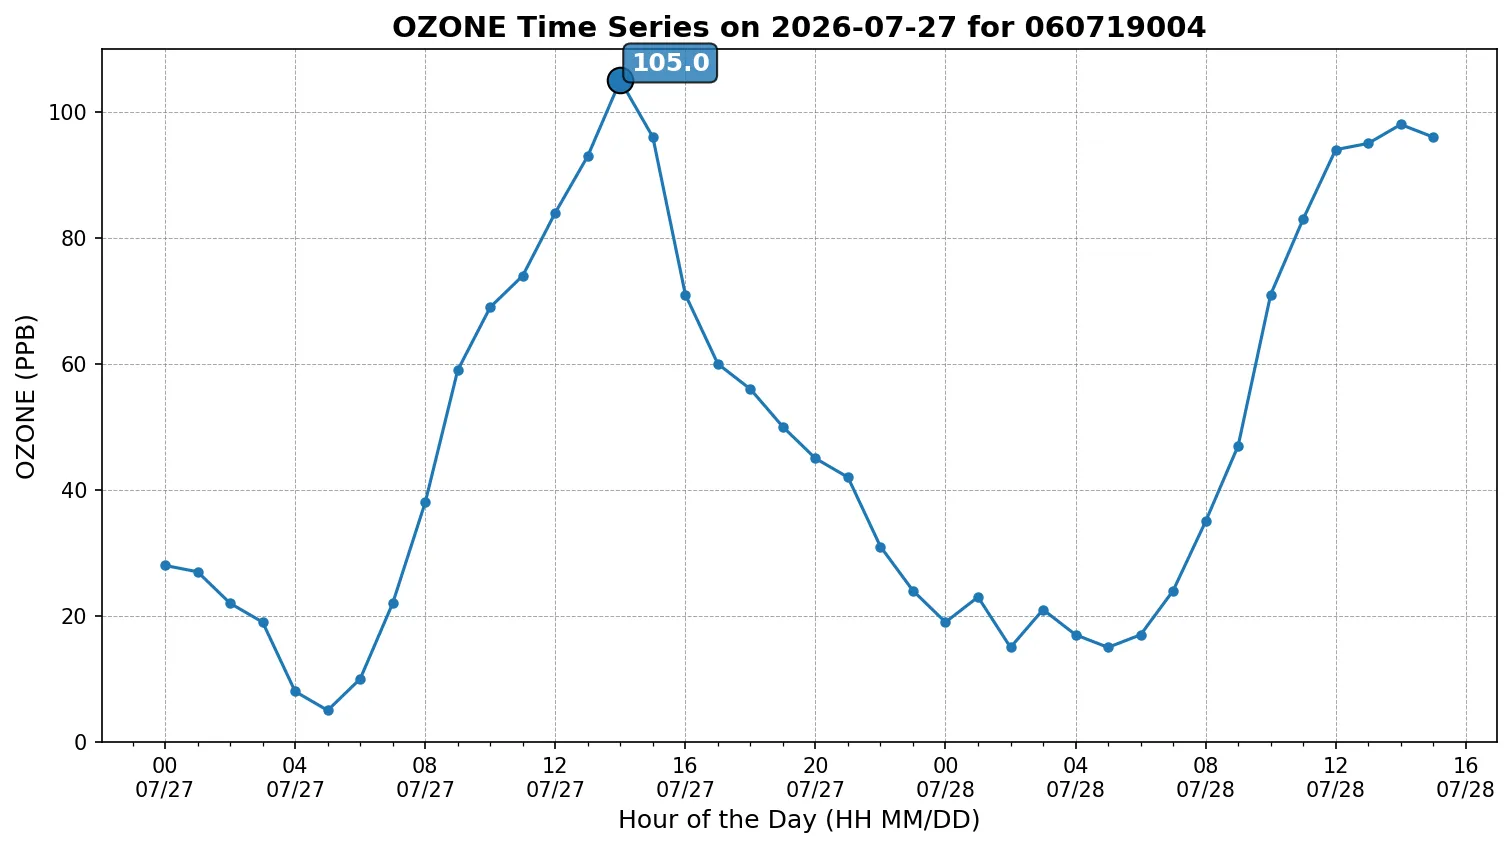
Time series of 1-hour ozone concentrations at San Bernadino - 4th Street starting on July 27, 2026. The number '1' indicates the highest 1-hour ozone concentration of the day, which is also the time used for HYSPLIT backward trajectory analysis.
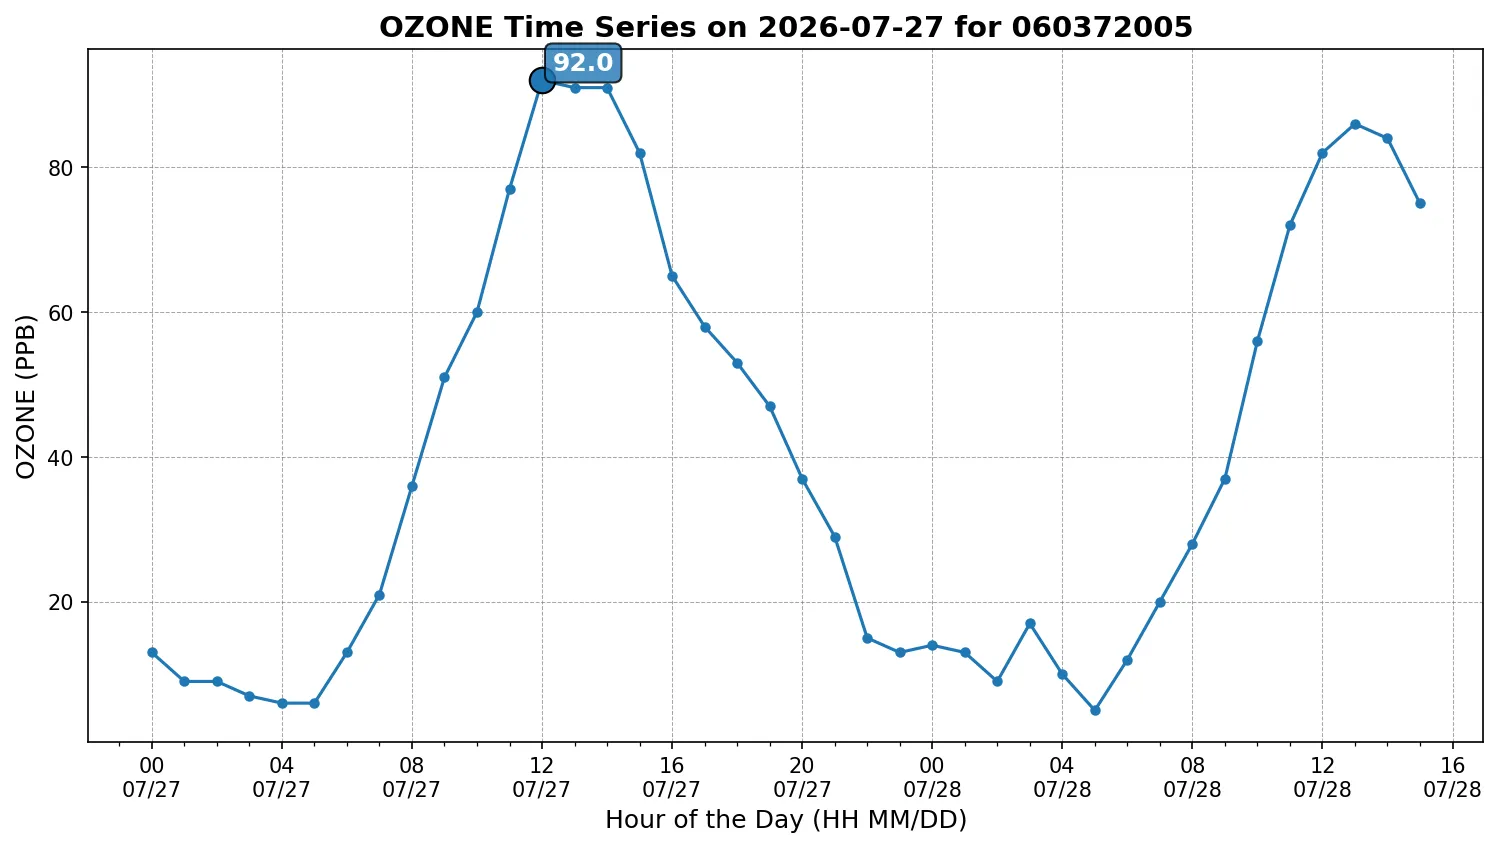
Time series of 1-hour ozone concentrations at Pasadena starting on July 27, 2026. The number '1' indicates the highest 1-hour ozone concentration of the day, which is also the time used for HYSPLIT backward trajectory analysis.
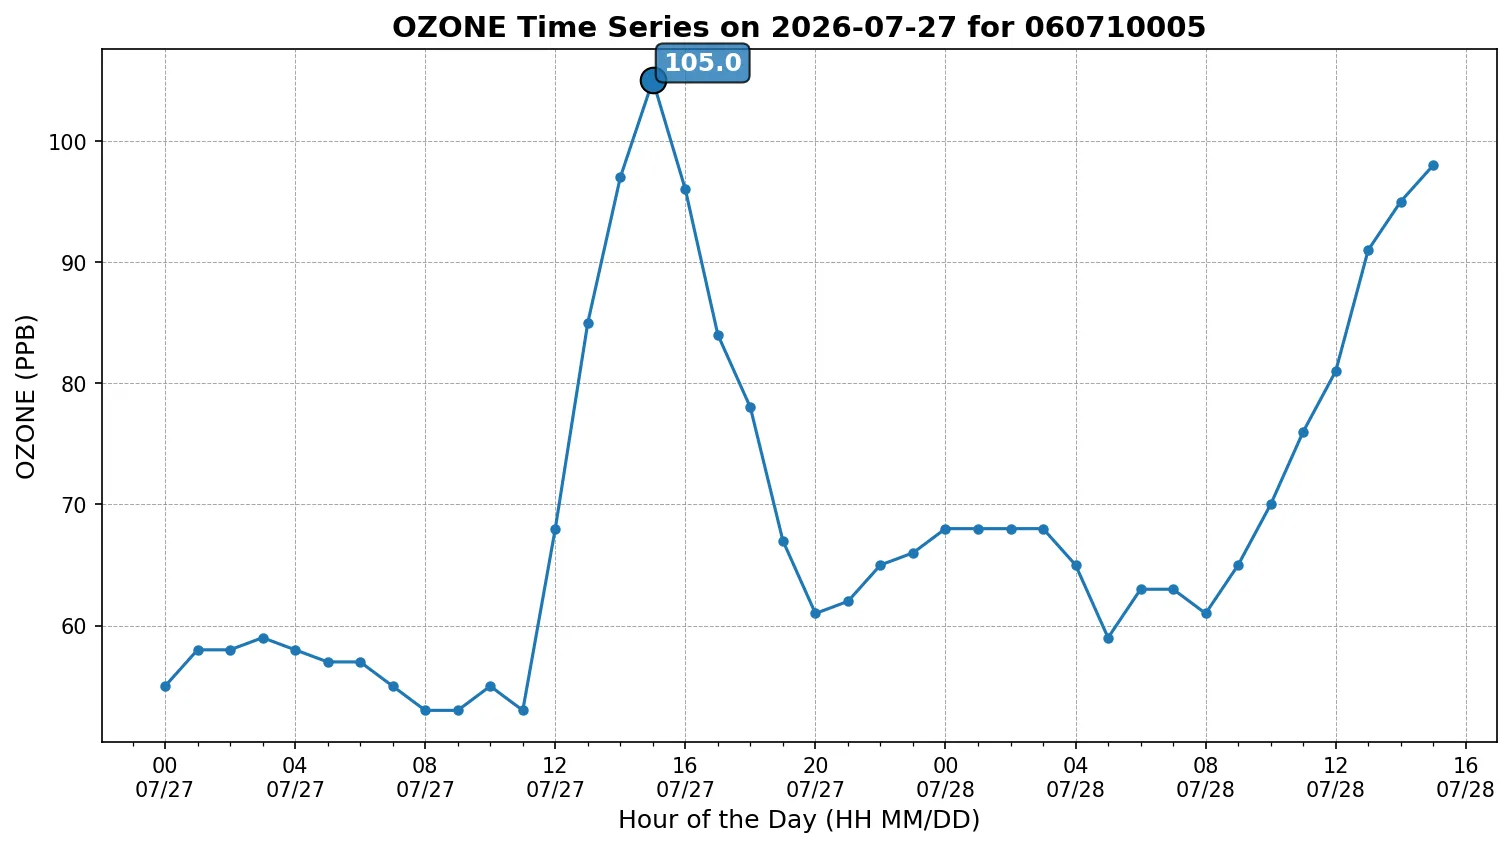
Time series of 1-hour ozone concentrations at Crestline - Lake Gregory starting on July 27, 2026. The number '1' indicates the highest 1-hour ozone concentration of the day, which is also the time used for HYSPLIT backward trajectory analysis.
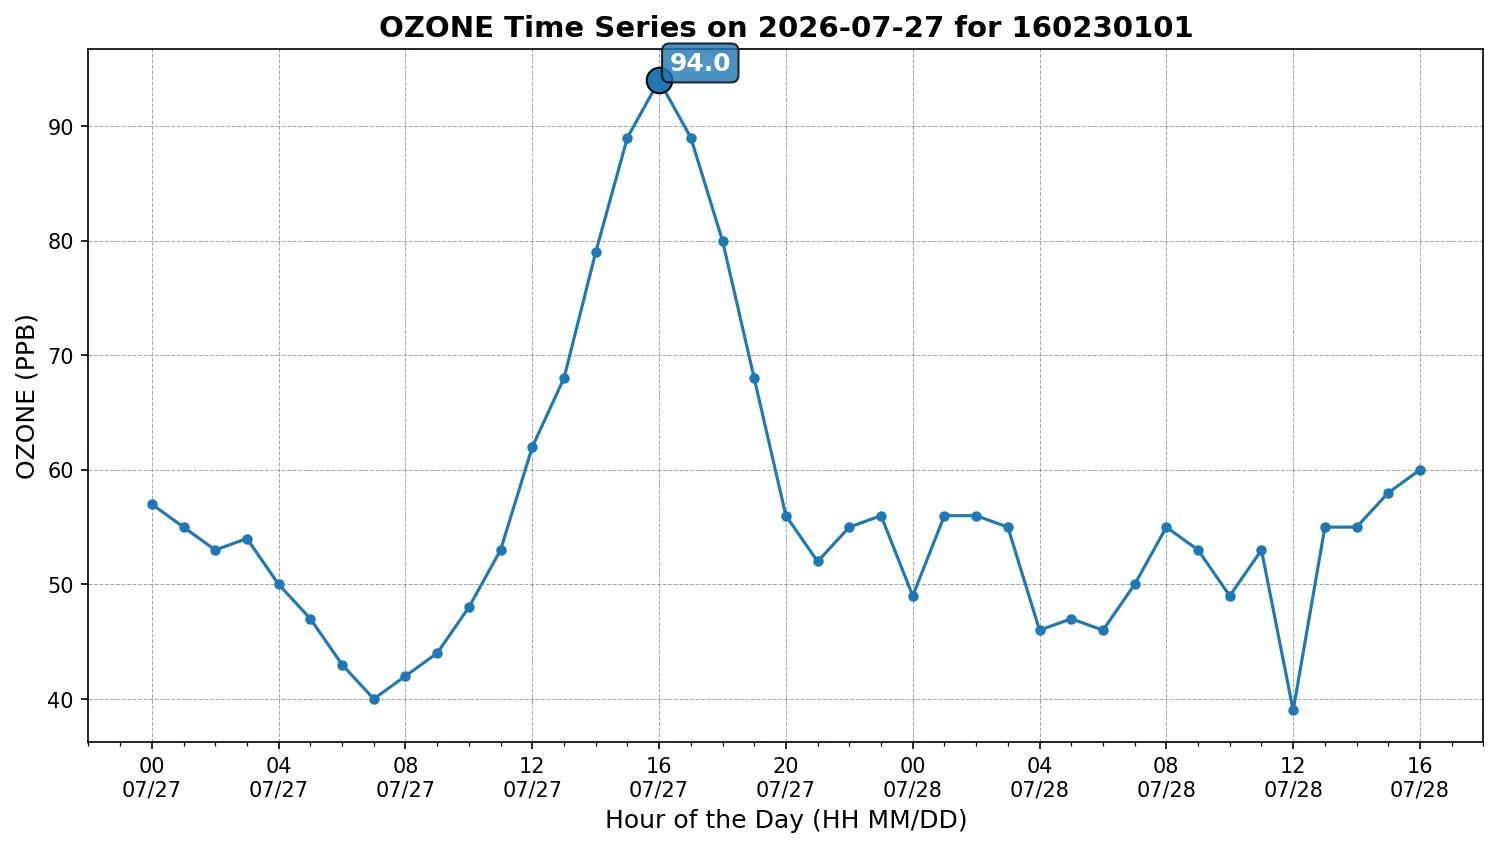
Time series of 1-hour ozone concentrations at Craters of the Moon NM starting on July 27, 2026. The number '1' indicates the highest 1-hour ozone concentration of the day, which is also the time used for HYSPLIT backward trajectory analysis.
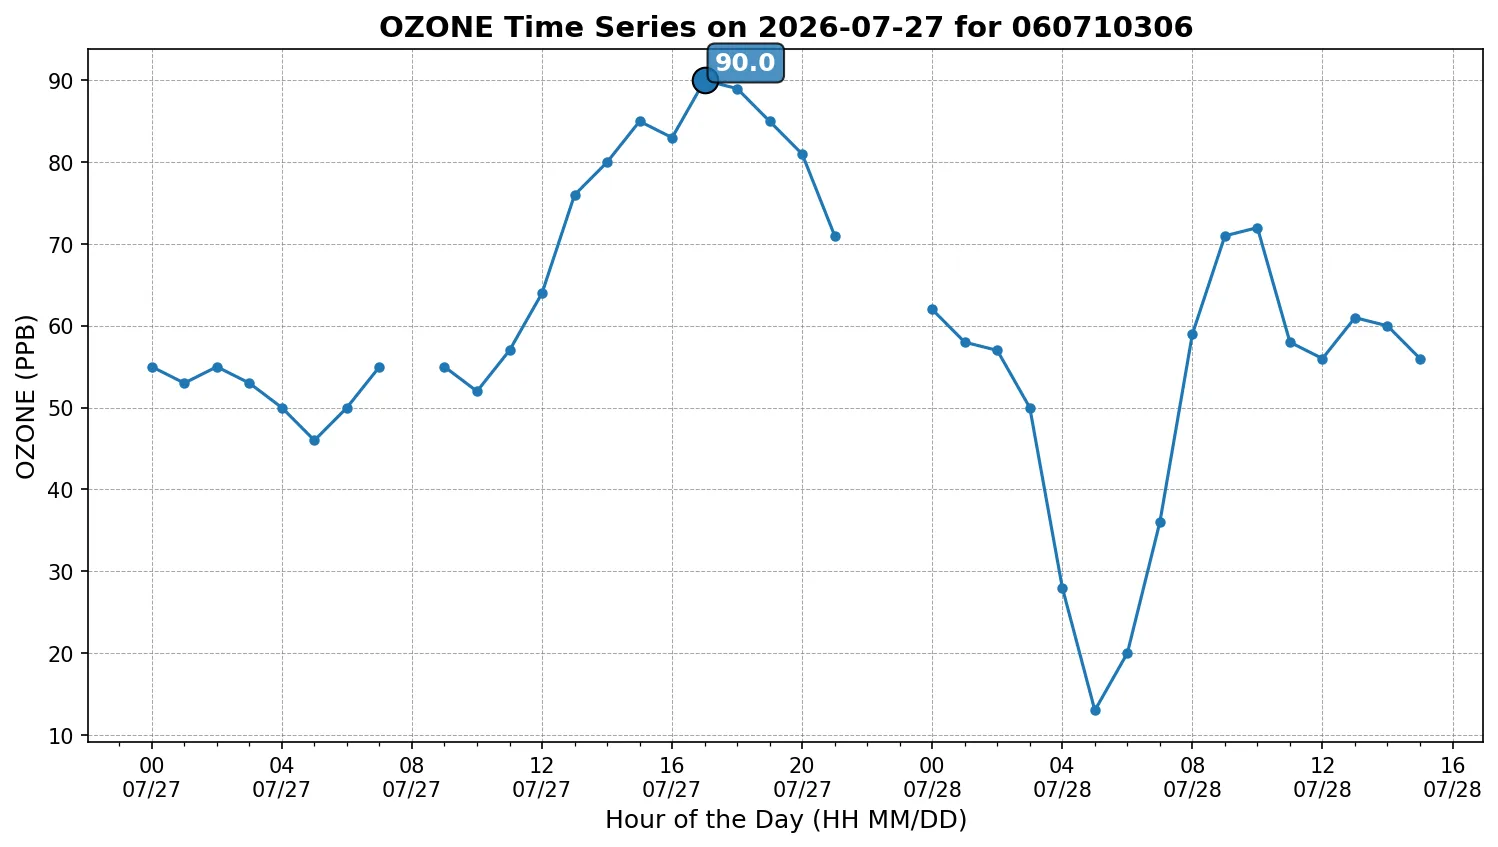
Time series of 1-hour ozone concentrations at Victorville - Park Avenue starting on July 27, 2026. The number '1' indicates the highest 1-hour ozone concentration of the day, which is also the time used for HYSPLIT backward trajectory analysis.
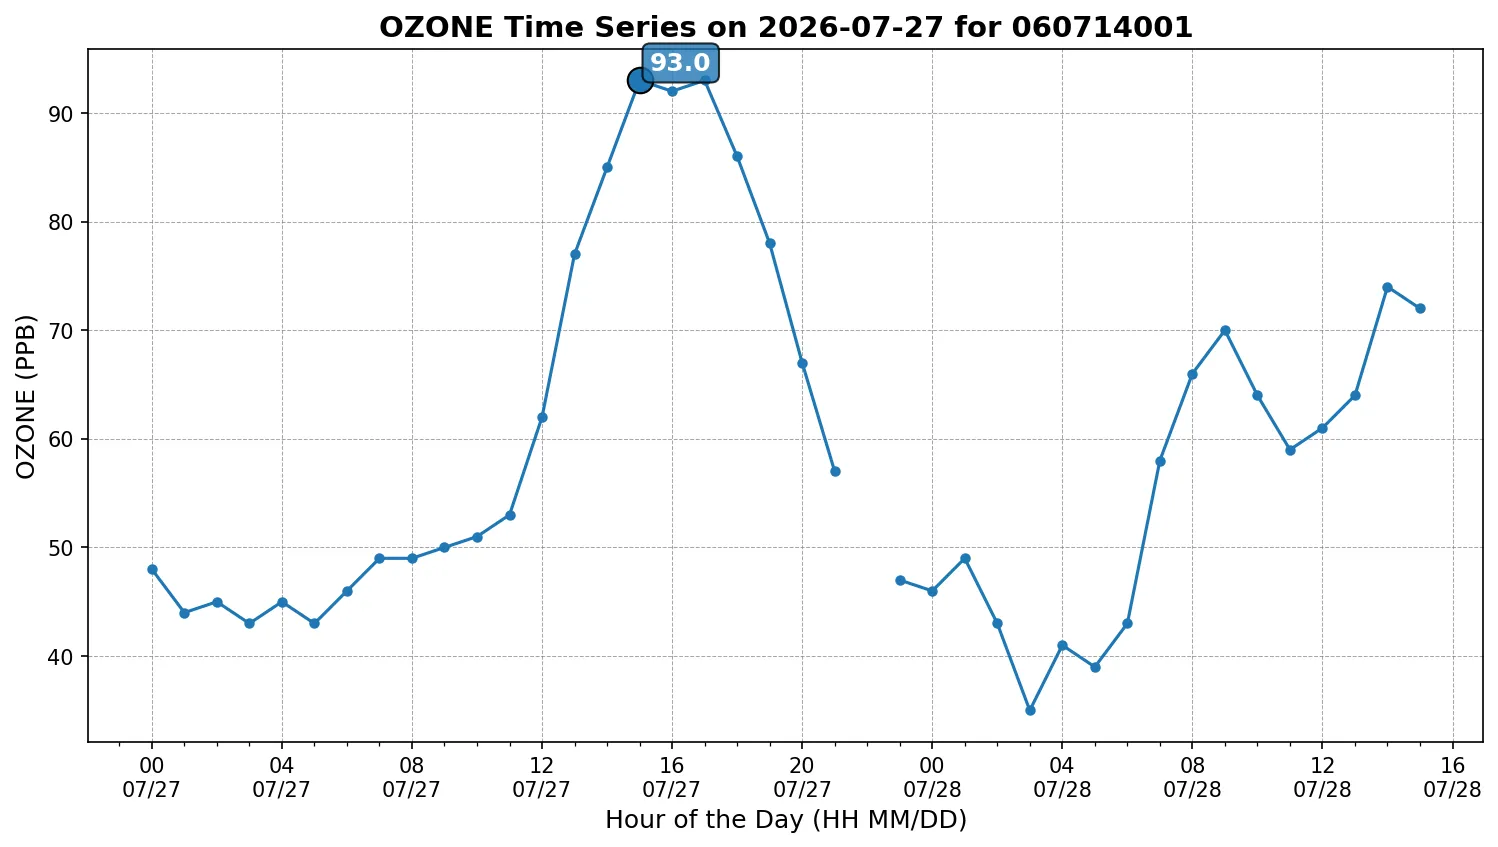
Time series of 1-hour ozone concentrations at Hesperia - Olive Street starting on July 27, 2026. The number '1' indicates the highest 1-hour ozone concentration of the day, which is also the time used for HYSPLIT backward trajectory analysis.
Historical Daily Maximum 8-Hour Ozone Concentration
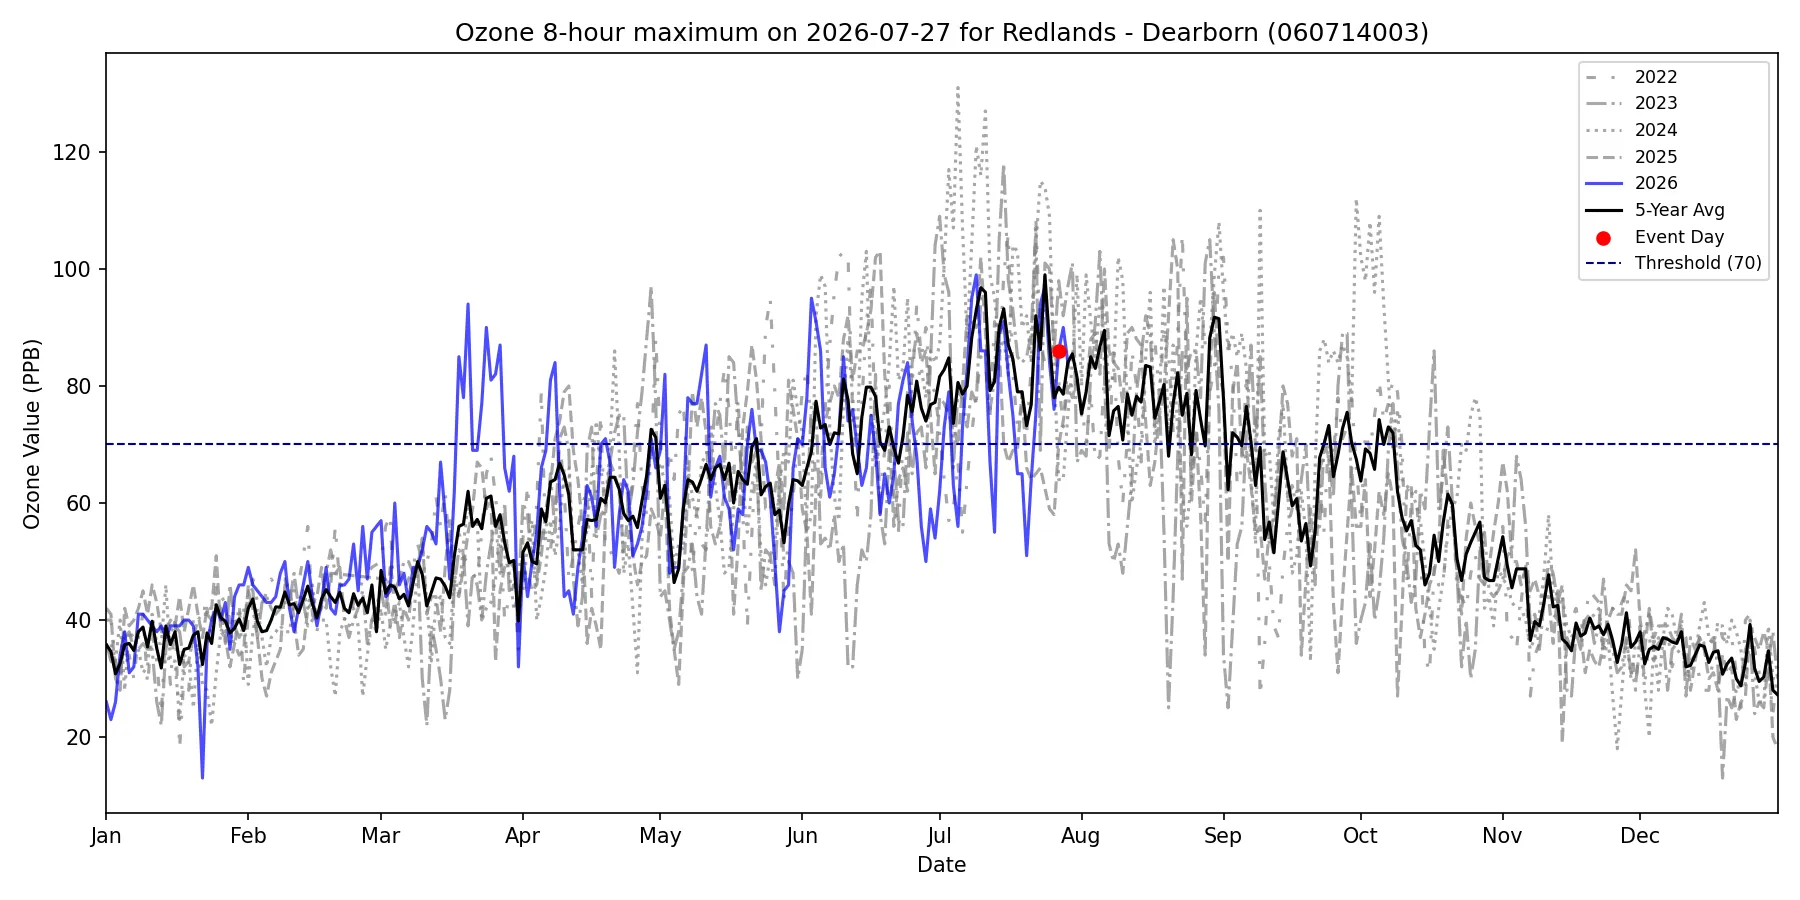
Time series plot of daily maximum 8-Hour ozone concentrations at Redlands - Dearborn for each year between 2022 and 2026. The colored dots represent the daily maximum 8-Hour ozone concentrations on July 27, 2026. The black line indicates the 5-year average daily maximum 8-Hour ozone concentration, and the grey dashed line represents the 70 ppb daily ozone standard.
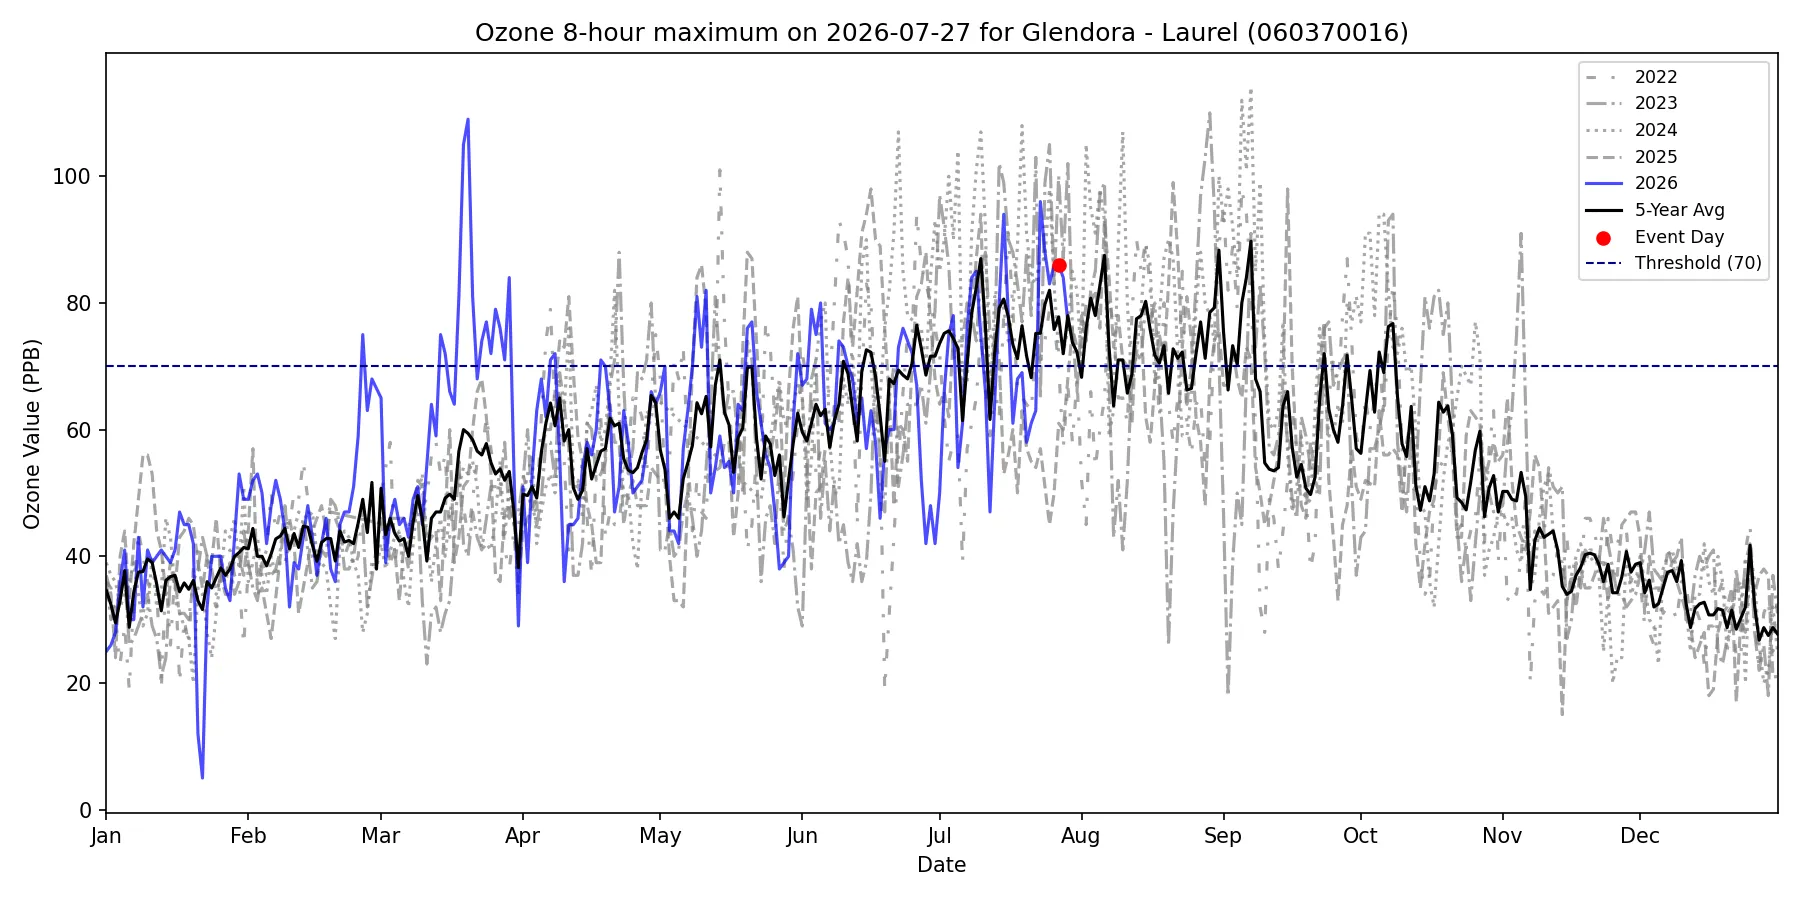
Time series plot of daily maximum 8-Hour ozone concentrations at Glendora - Laurel for each year between 2022 and 2026. The colored dots represent the daily maximum 8-Hour ozone concentrations on July 27, 2026. The black line indicates the 5-year average daily maximum 8-Hour ozone concentration, and the grey dashed line represents the 70 ppb daily ozone standard.
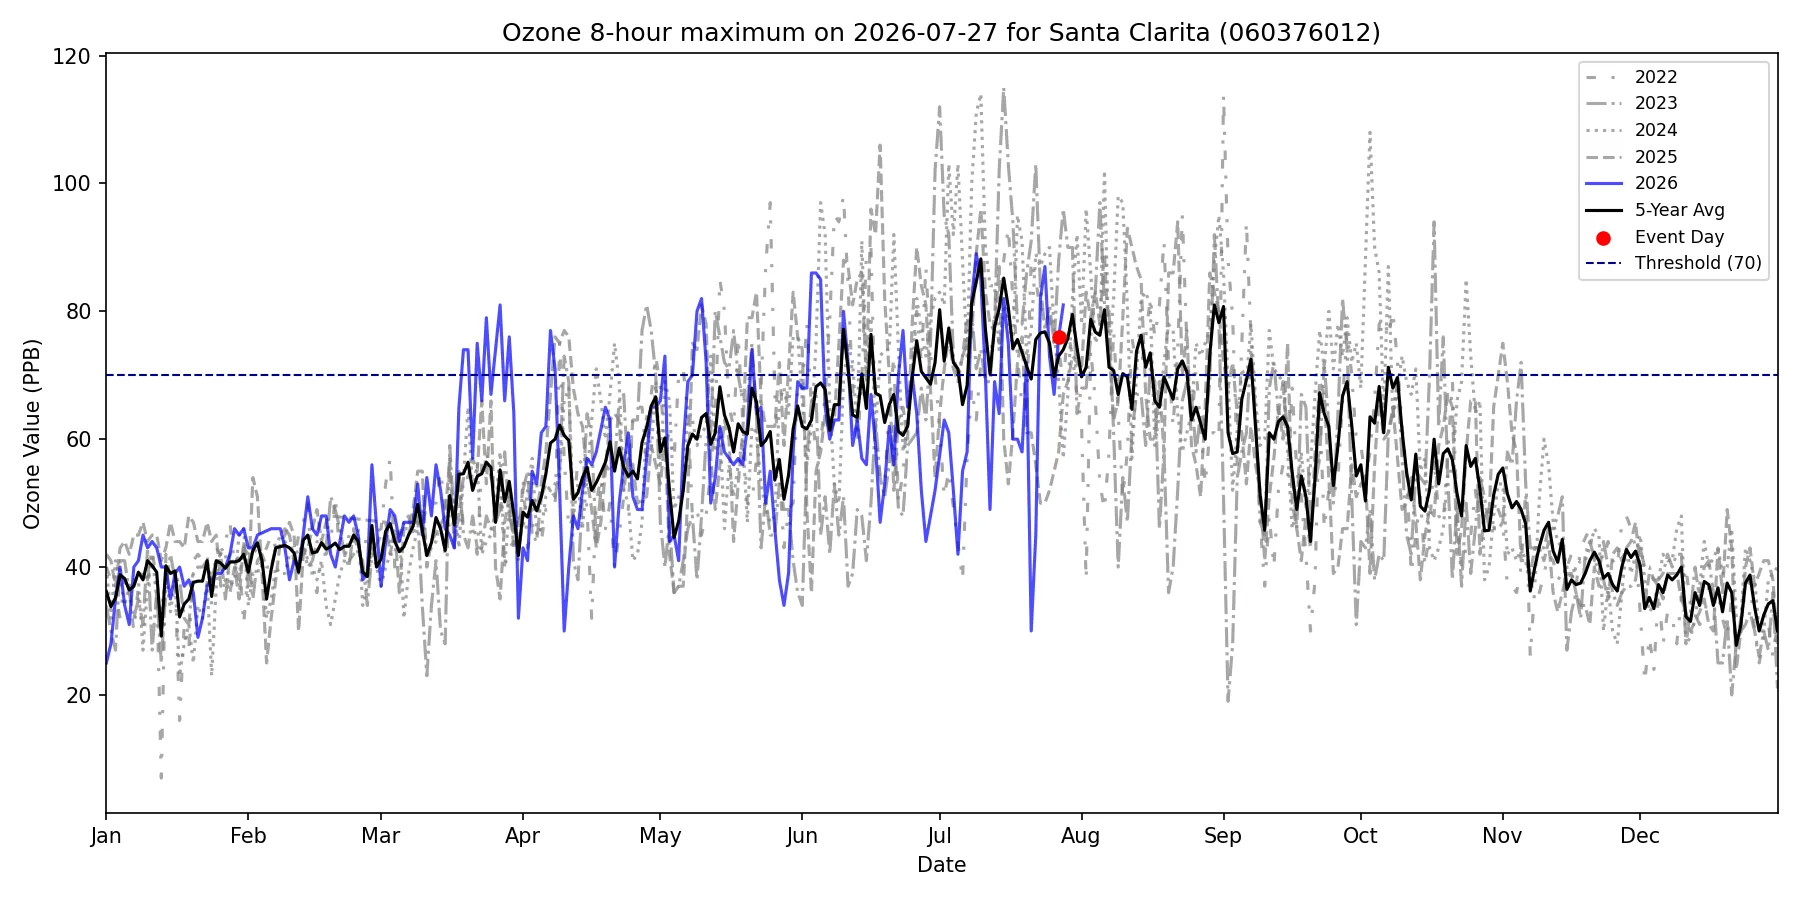
Time series plot of daily maximum 8-Hour ozone concentrations at Santa Clarita for each year between 2022 and 2026. The colored dots represent the daily maximum 8-Hour ozone concentrations on July 27, 2026. The black line indicates the 5-year average daily maximum 8-Hour ozone concentration, and the grey dashed line represents the 70 ppb daily ozone standard.
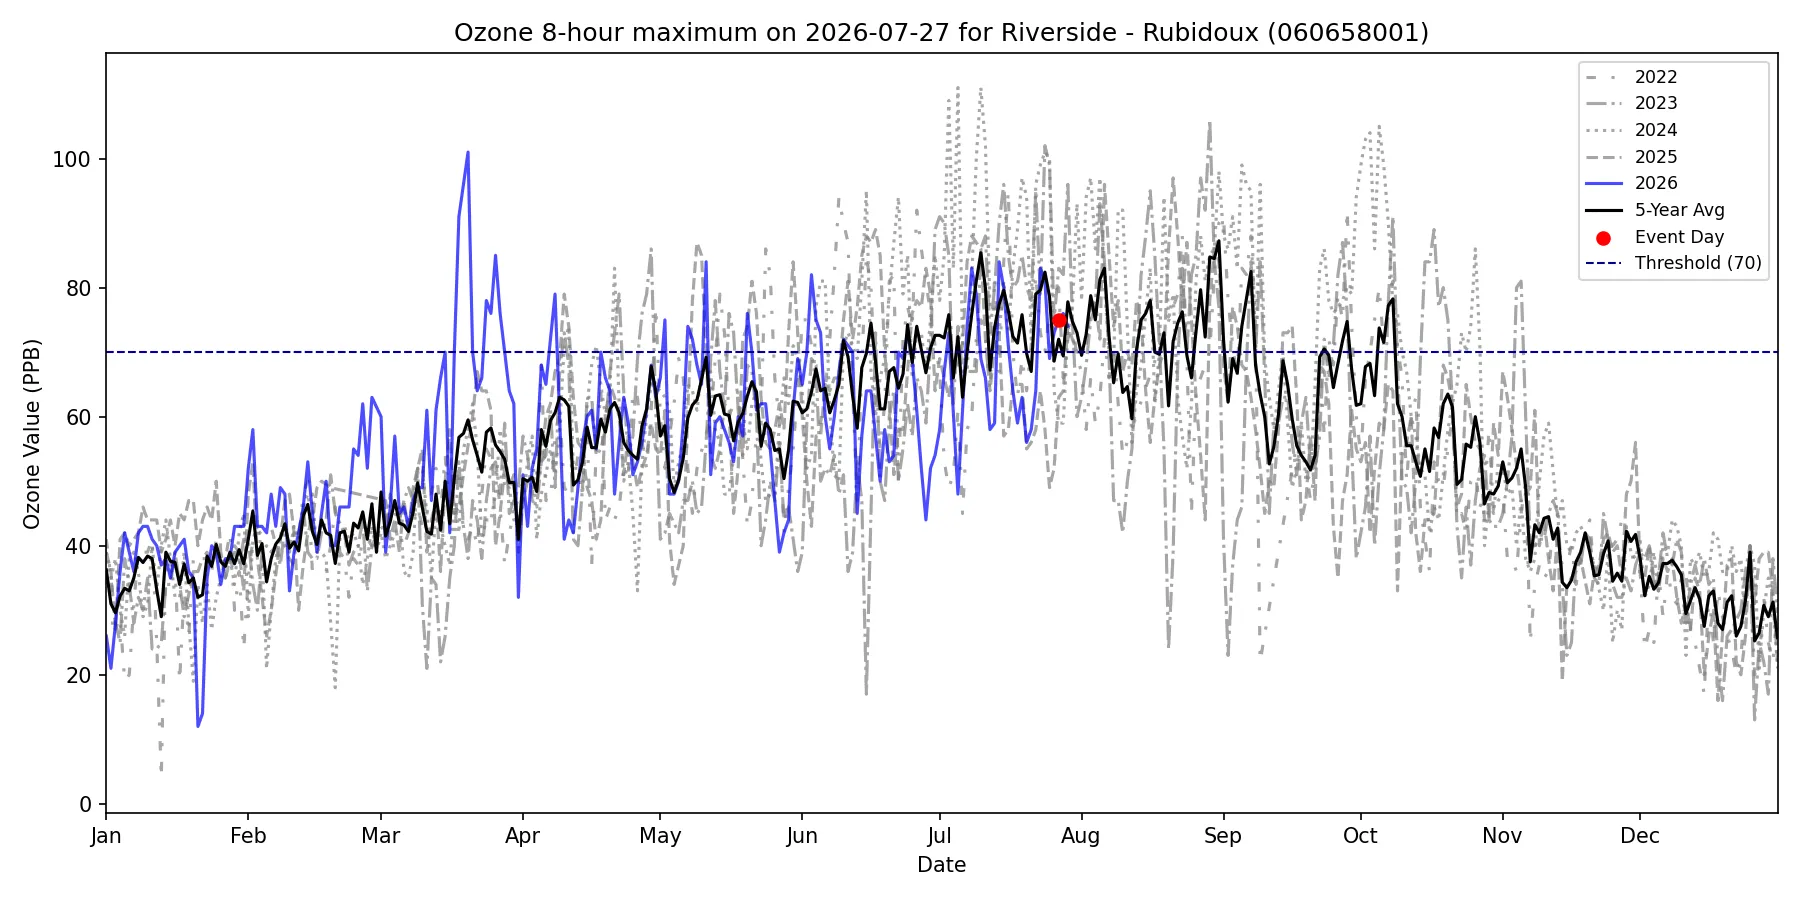
Time series plot of daily maximum 8-Hour ozone concentrations at Riverside - Rubidoux for each year between 2022 and 2026. The colored dots represent the daily maximum 8-Hour ozone concentrations on July 27, 2026. The black line indicates the 5-year average daily maximum 8-Hour ozone concentration, and the grey dashed line represents the 70 ppb daily ozone standard.
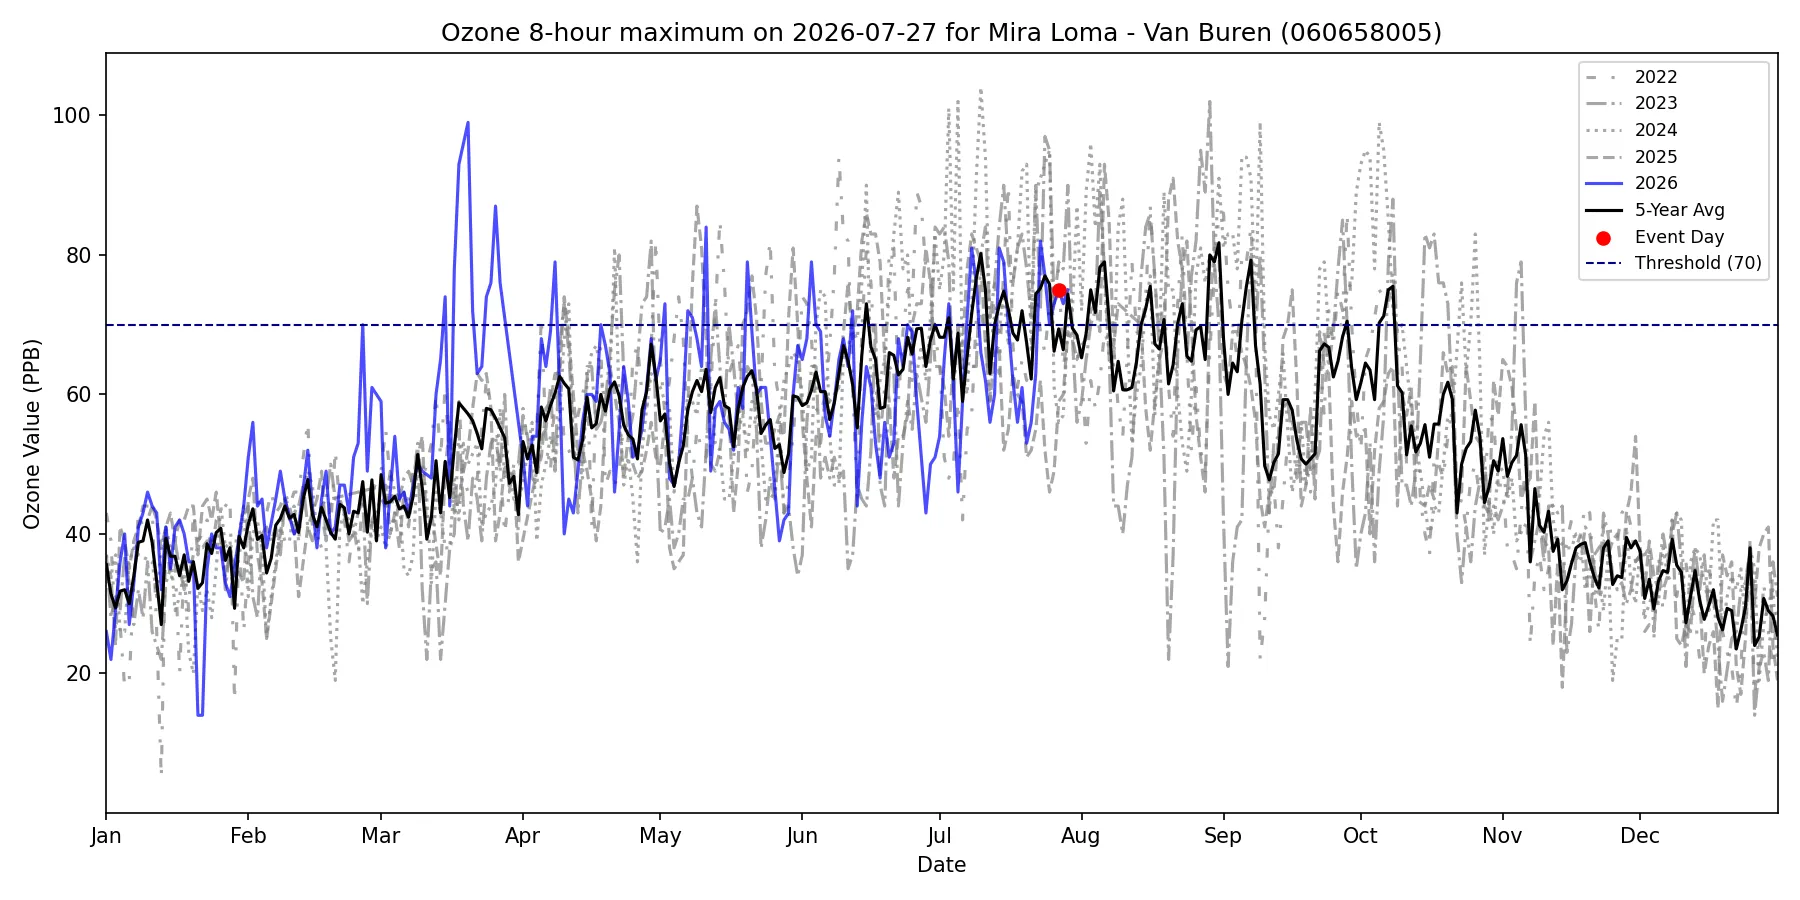
Time series plot of daily maximum 8-Hour ozone concentrations at Mira Loma - Van Buren for each year between 2022 and 2026. The colored dots represent the daily maximum 8-Hour ozone concentrations on July 27, 2026. The black line indicates the 5-year average daily maximum 8-Hour ozone concentration, and the grey dashed line represents the 70 ppb daily ozone standard.
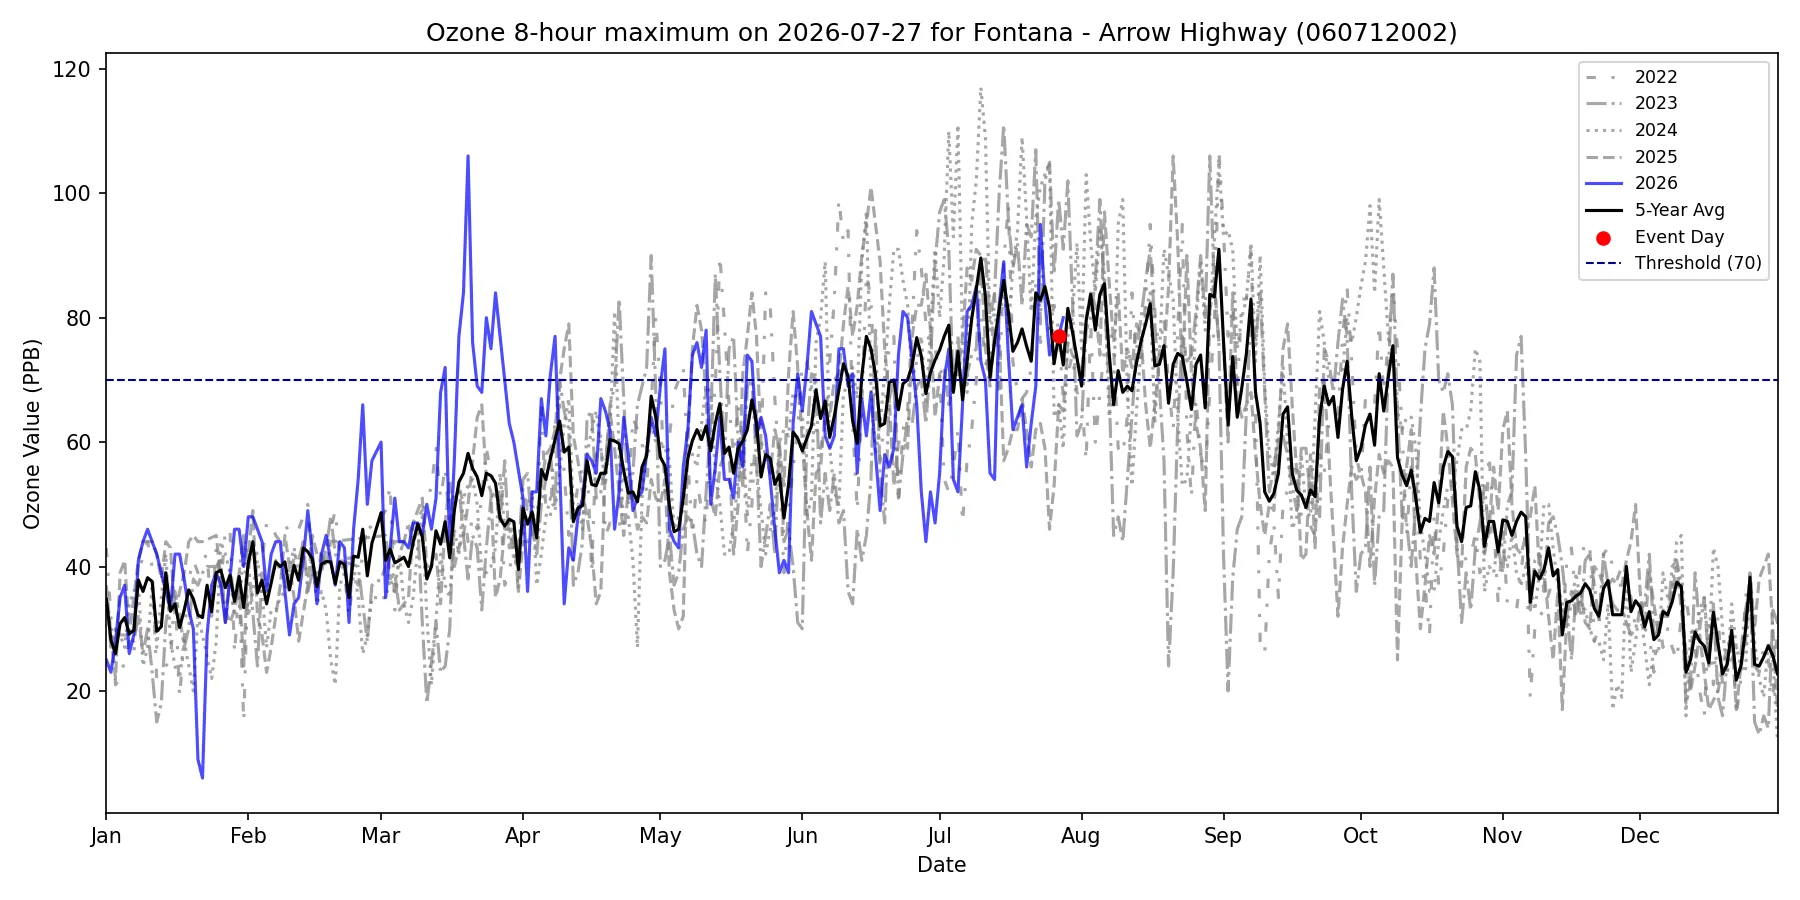
Time series plot of daily maximum 8-Hour ozone concentrations at Fontana - Arrow Highway for each year between 2022 and 2026. The colored dots represent the daily maximum 8-Hour ozone concentrations on July 27, 2026. The black line indicates the 5-year average daily maximum 8-Hour ozone concentration, and the grey dashed line represents the 70 ppb daily ozone standard.
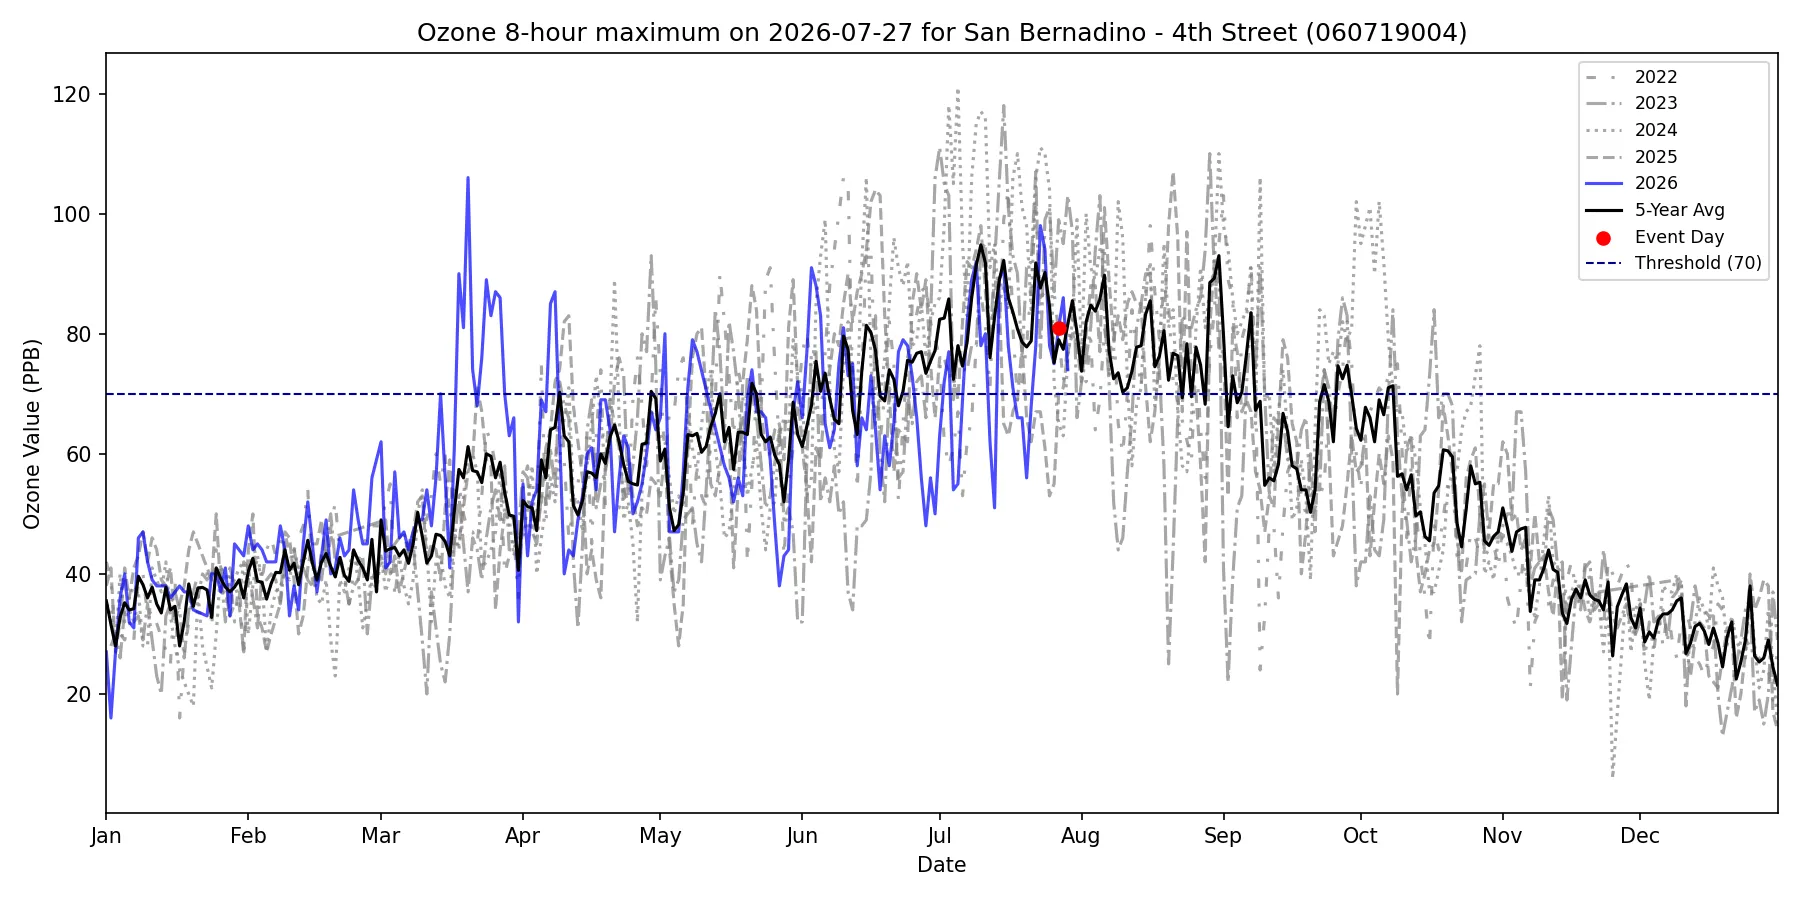
Time series plot of daily maximum 8-Hour ozone concentrations at San Bernadino - 4th Street for each year between 2022 and 2026. The colored dots represent the daily maximum 8-Hour ozone concentrations on July 27, 2026. The black line indicates the 5-year average daily maximum 8-Hour ozone concentration, and the grey dashed line represents the 70 ppb daily ozone standard.
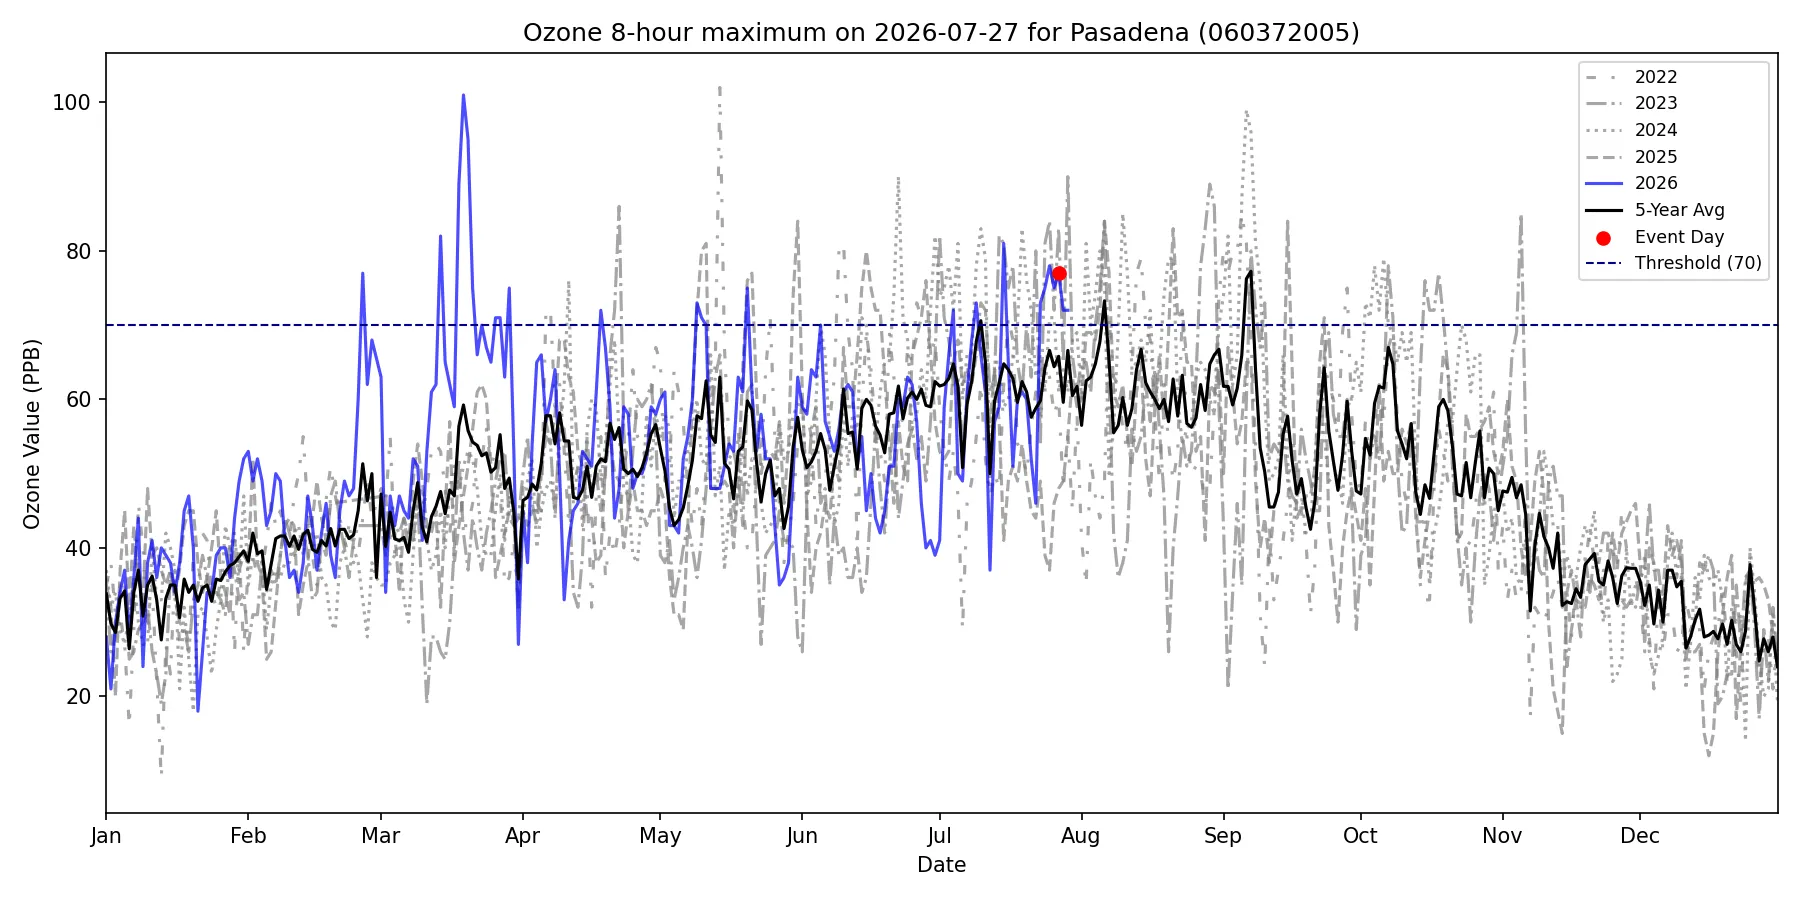
Time series plot of daily maximum 8-Hour ozone concentrations at Pasadena for each year between 2022 and 2026. The colored dots represent the daily maximum 8-Hour ozone concentrations on July 27, 2026. The black line indicates the 5-year average daily maximum 8-Hour ozone concentration, and the grey dashed line represents the 70 ppb daily ozone standard.
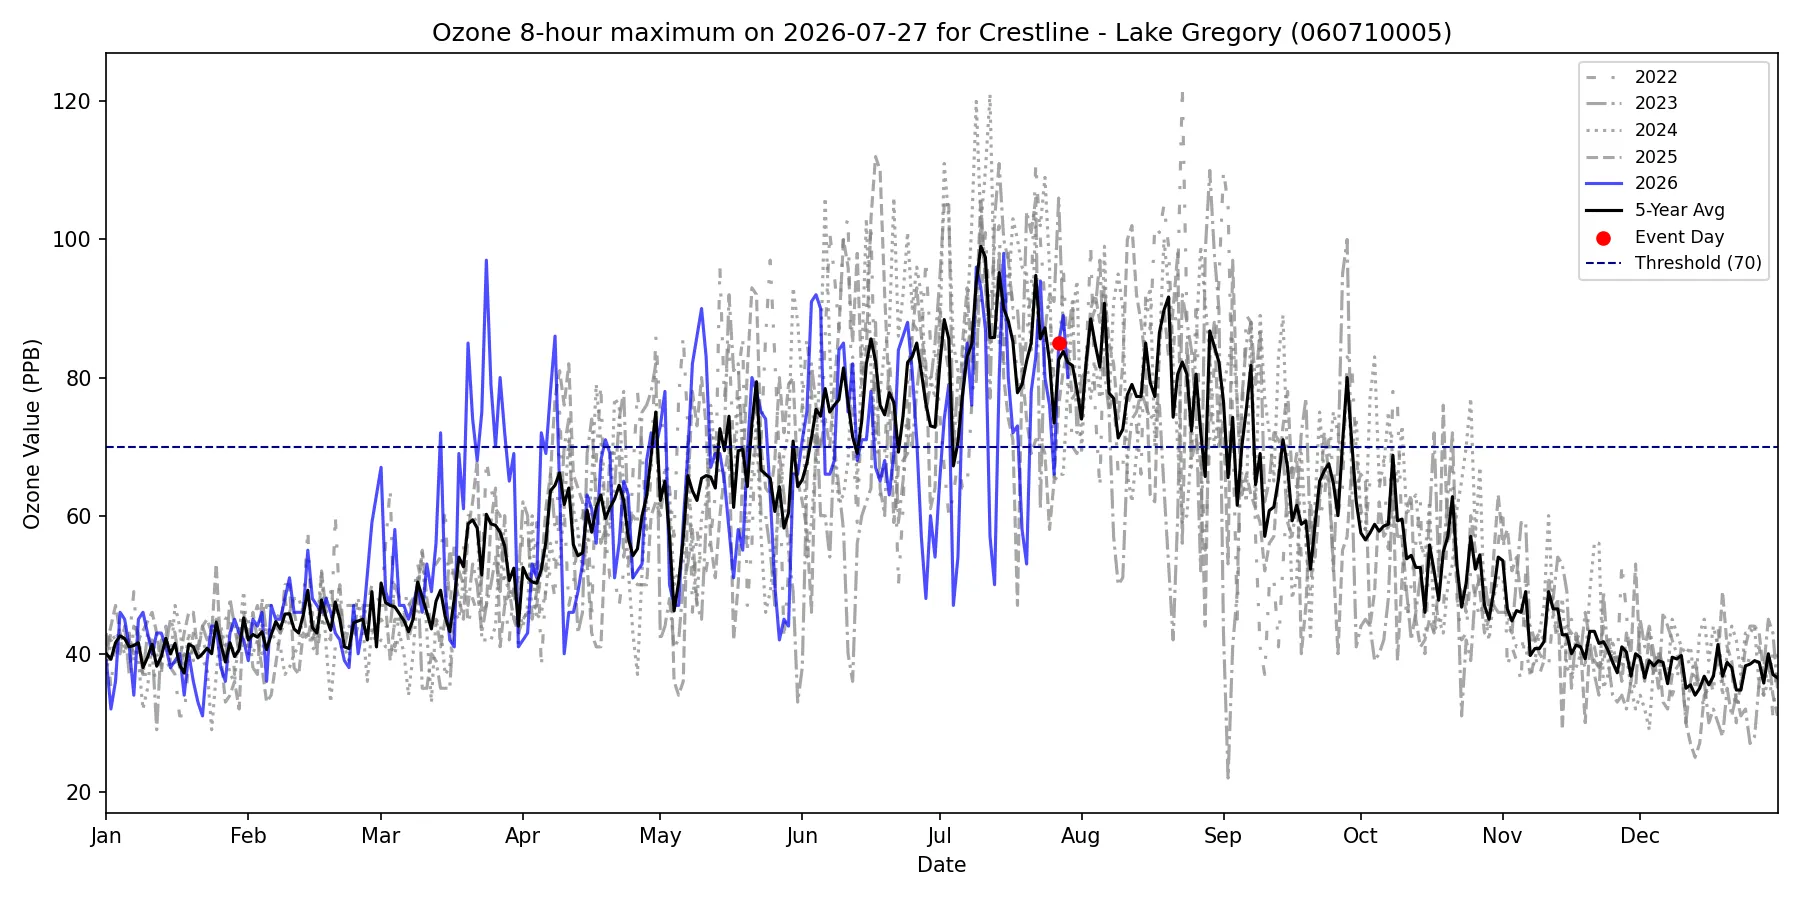
Time series plot of daily maximum 8-Hour ozone concentrations at Crestline - Lake Gregory for each year between 2022 and 2026. The colored dots represent the daily maximum 8-Hour ozone concentrations on July 27, 2026. The black line indicates the 5-year average daily maximum 8-Hour ozone concentration, and the grey dashed line represents the 70 ppb daily ozone standard.
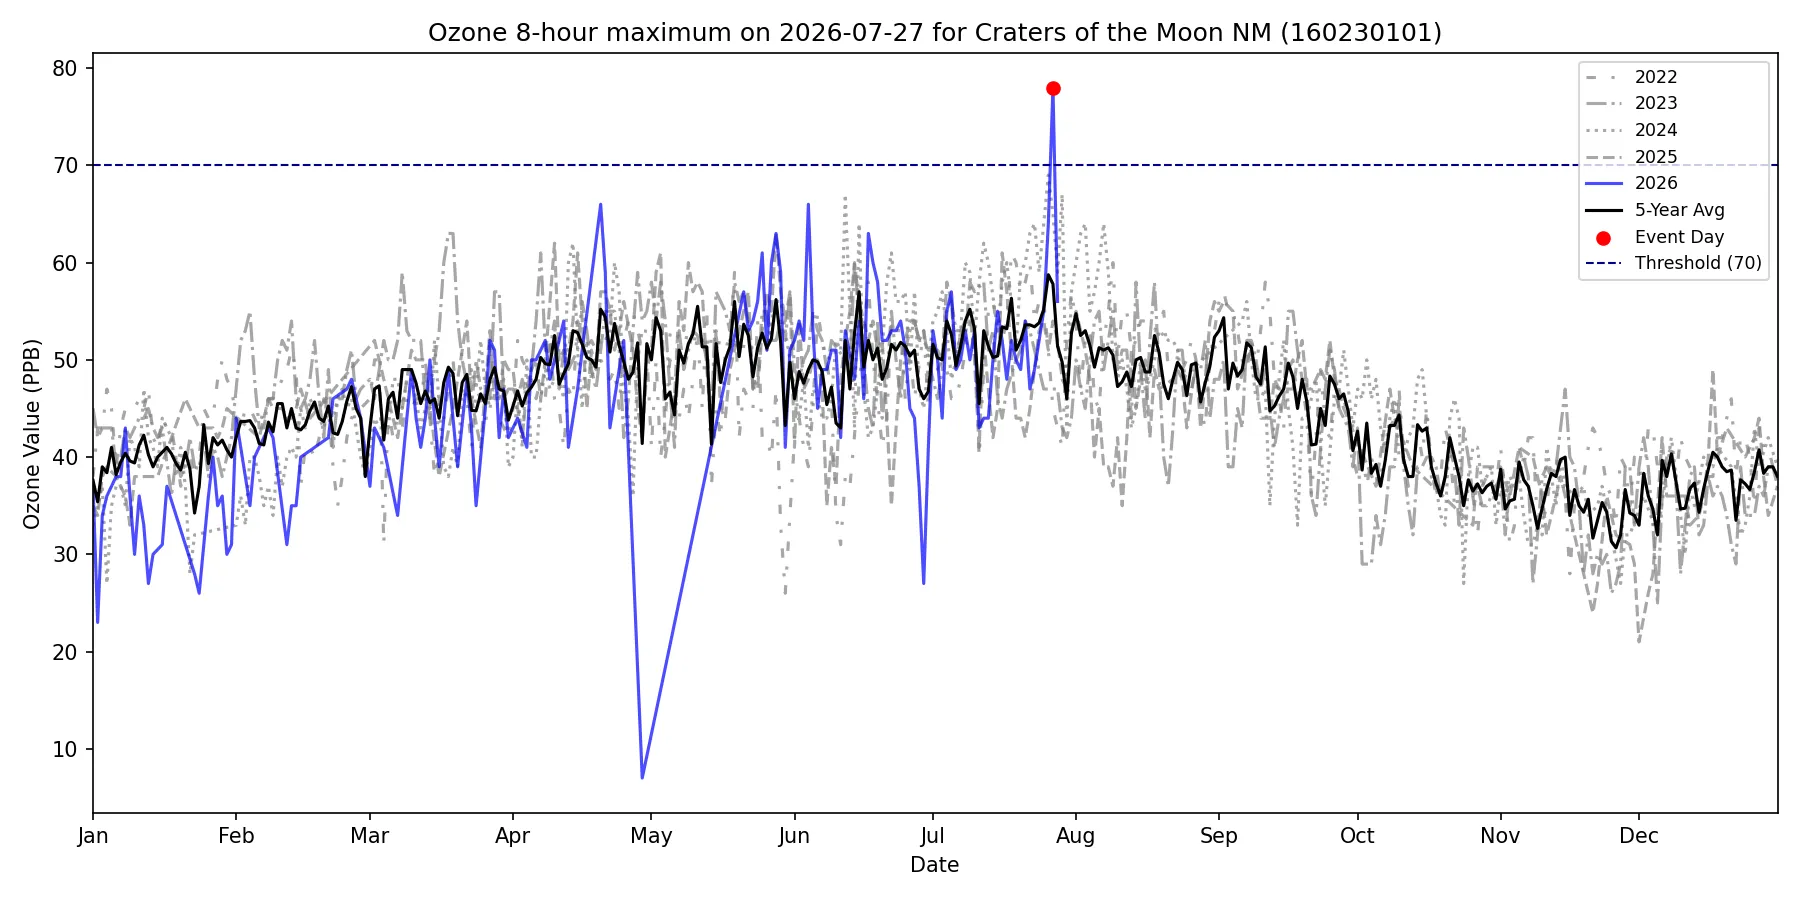
Time series plot of daily maximum 8-Hour ozone concentrations at Craters of the Moon NM for each year between 2022 and 2026. The colored dots represent the daily maximum 8-Hour ozone concentrations on July 27, 2026. The black line indicates the 5-year average daily maximum 8-Hour ozone concentration, and the grey dashed line represents the 70 ppb daily ozone standard.
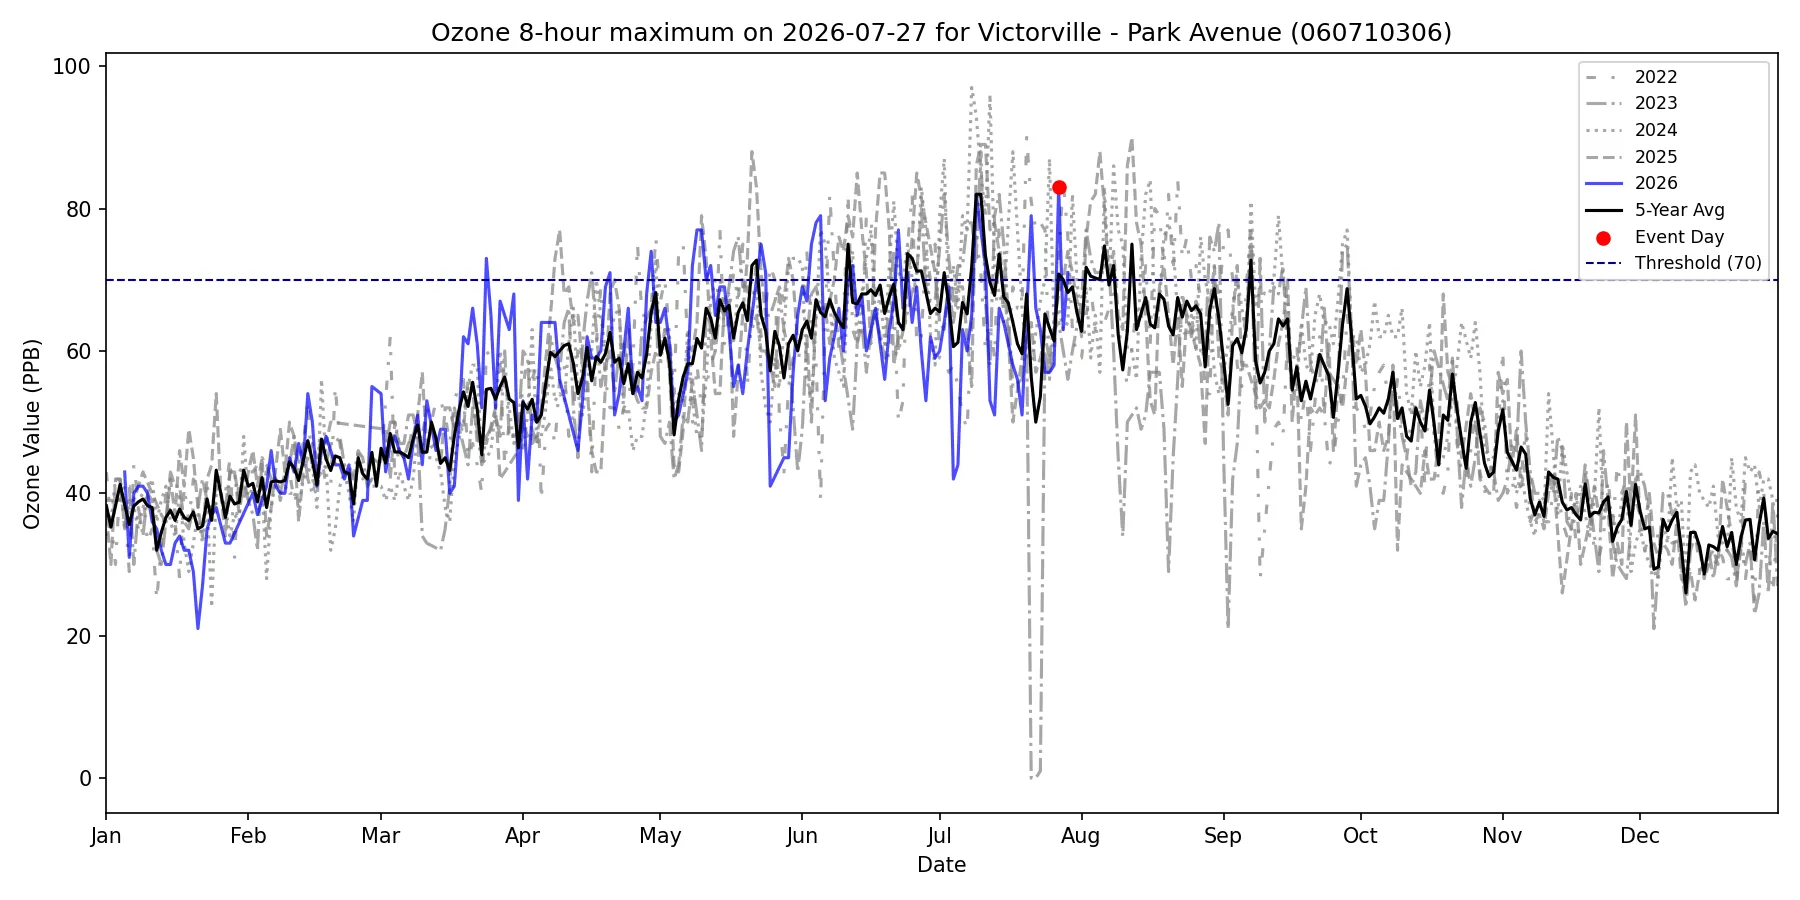
Time series plot of daily maximum 8-Hour ozone concentrations at Victorville - Park Avenue for each year between 2022 and 2026. The colored dots represent the daily maximum 8-Hour ozone concentrations on July 27, 2026. The black line indicates the 5-year average daily maximum 8-Hour ozone concentration, and the grey dashed line represents the 70 ppb daily ozone standard.
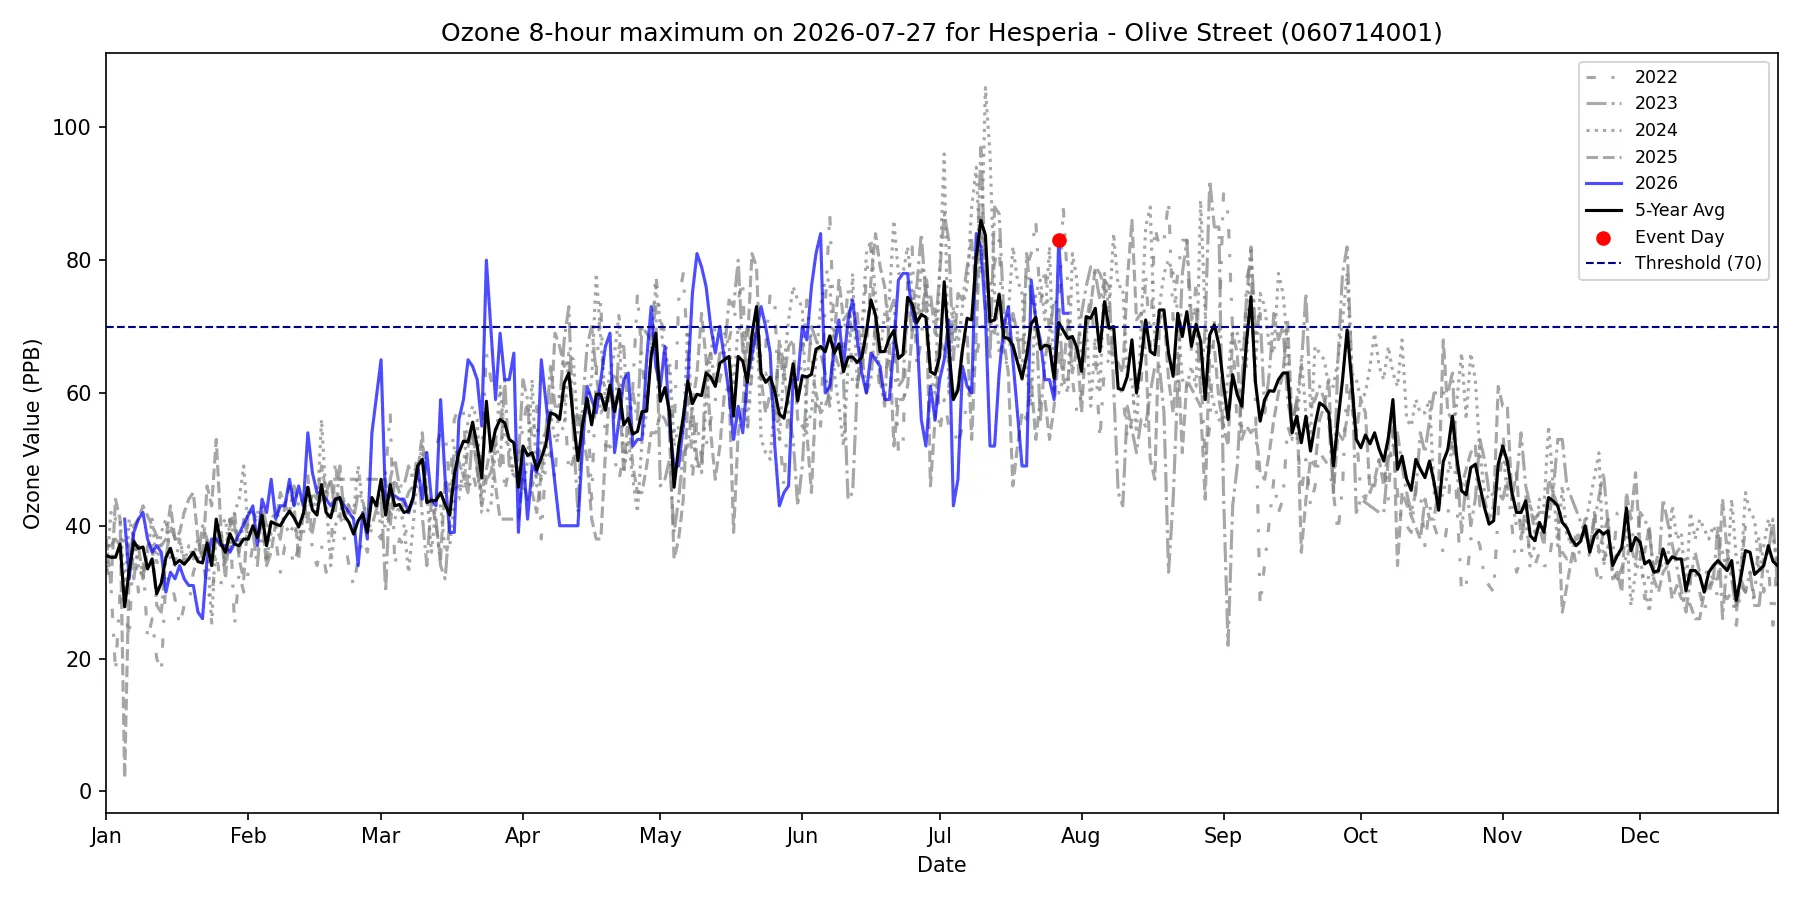
Time series plot of daily maximum 8-Hour ozone concentrations at Hesperia - Olive Street for each year between 2022 and 2026. The colored dots represent the daily maximum 8-Hour ozone concentrations on July 27, 2026. The black line indicates the 5-year average daily maximum 8-Hour ozone concentration, and the grey dashed line represents the 70 ppb daily ozone standard.
Prescribed Fires within 50 Miles
| Monitor AQS ID | On the Day | One Day Before | Two Days Before |
|---|---|---|---|
| 060714003 |
|
|
|
| 060370016 |
|
|
|
| 060376012 |
|
|
|
| 060658001 |
|
|
|
| 060658005 |
|
|
|
| 060712002 |
|
|
|
| 060719004 |
|
|
|
| 060372005 |
|
|
|
| 060710005 |
|
|
|
| 160230101 |
|
|
|
| 060710306 |
|
|
|
| 060714001 |
|
|
|
Wildfires within 100 Miles
| Monitor AQS ID | 2-Day Range to Exceedance Date |
|---|---|
| 060714003 |
|
| 060370016 |
|
| 060376012 |
|
| 060658001 |
|
| 060658005 |
|
| 060712002 |
|
| 060719004 |
|
| 060372005 |
|
| 060710005 |
|
| 160230101 |
|
| 060710306 |
|
| 060714001 |
|
Fire Emission Analysis
| Monitor AQS ID | Emission Analysis |
|---|---|
| 060714003 | On July 27, 2026, an analysis was conducted to assess the potential impact of nearby fire activity on ozone levels at Redlands - Dearborn. 5 wildfires were detected within 100 miles of the site from two days before the event to the event day. The proximity of these fires to the site suggests they may have contributed to elevated ozone levels on this date. The following wildfires were identified: Rider Fire, which burned 140.00, started on July 21, 2026, and last updated on July 26, 2026. It was located 17.5 miles away. Creelman Fire, which burned 347.00, started on July 22, 2026, and ended on July 25, 2026. It was located 74.2 miles away. Kirby Fire, which burned 46.00, started on July 23, 2026, and last updated on July 26, 2026. It was located 45.1 miles away. Tin Fire, which burned 37.00, started on July 26, 2026, and ended on July 27, 2026. It was located 23.4 miles away. Keller Fire, which burned 10.00, started on July 26, 2026, and ended on July 27, 2026. It was located 29.9 miles away. No prescribed fires were identified within 50 miles of Redlands - Dearborn. In addition to reported prescribed fire and wildfire records from CAL FIRE and the Prescribed Fire Reporting System (PFIRS), satellite imagery detected 94 fire hotspots over the past two days (from two days before the event to the current day) within 100 miles of the site. This indicates ongoing fire activity in the region, which may have contributed to the observed air quality conditions. Satellite data confirms the presence of smoke plumes over the monitoring site, suggesting that emissions from nearby fires were transported into the area, potentially impacting ozone levels. |
| 060370016 | On July 27, 2026, an analysis was conducted to assess the potential impact of nearby fire activity on ozone levels at Glendora - Laurel. 6 wildfires were detected within 100 miles of the site from two days before the event to the event day. The proximity of these fires to the site suggests they may have contributed to elevated ozone levels on this date. The following wildfires were identified: Rider Fire, which burned 140.00, started on July 21, 2026, and last updated on July 26, 2026. It was located 40.2 miles away. Creelman Fire, which burned 347.00, started on July 22, 2026, and ended on July 25, 2026. It was located 97.1 miles away. Kirby Fire, which burned 46.00, started on July 23, 2026, and last updated on July 26, 2026. It was located 80.1 miles away. Tin Fire, which burned 37.00, started on July 26, 2026, and ended on July 27, 2026. It was located 30.3 miles away. Keller Fire, which burned 10.00, started on July 26, 2026, and ended on July 27, 2026. It was located 52.8 miles away. Fish Fire, which burned 4201.00, started on July 27, 2026, and last updated on July 29, 2026. It was located 92.6 miles away. No prescribed fires were identified within 50 miles of Glendora - Laurel. In addition to reported prescribed fire and wildfire records from CAL FIRE and the Prescribed Fire Reporting System (PFIRS), satellite imagery detected 744 fire hotspots over the past two days (from two days before the event to the current day) within 100 miles of the site. This indicates ongoing fire activity in the region, which may have contributed to the observed air quality conditions. Satellite data confirms the presence of smoke plumes over the monitoring site, suggesting that emissions from nearby fires were transported into the area, potentially impacting ozone levels. |
| 060376012 | On July 27, 2026, an analysis was conducted to assess the potential impact of nearby fire activity on ozone levels at Santa Clarita. 4 wildfires were detected within 100 miles of the site from two days before the event to the event day. The proximity of these fires to the site suggests they may have contributed to elevated ozone levels on this date. The following wildfires were identified: Rider Fire, which burned 140.00, started on July 21, 2026, and last updated on July 26, 2026. It was located 82.0 miles away. Tin Fire, which burned 37.00, started on July 26, 2026, and ended on July 27, 2026. It was located 71.4 miles away. Keller Fire, which burned 10.00, started on July 26, 2026, and ended on July 27, 2026. It was located 93.6 miles away. Fish Fire, which burned 4201.00, started on July 27, 2026, and last updated on July 29, 2026. It was located 64.1 miles away. No prescribed fires were identified within 50 miles of Santa Clarita. In addition to reported prescribed fire and wildfire records from CAL FIRE and the Prescribed Fire Reporting System (PFIRS), satellite imagery detected 752 fire hotspots over the past two days (from two days before the event to the current day) within 100 miles of the site. This indicates ongoing fire activity in the region, which may have contributed to the observed air quality conditions. Satellite data confirms the presence of smoke plumes over the monitoring site, suggesting that emissions from nearby fires were transported into the area, potentially impacting ozone levels. |
| 060658001 | On July 27, 2026, an analysis was conducted to assess the potential impact of nearby fire activity on ozone levels at Riverside - Rubidoux. 5 wildfires were detected within 100 miles of the site from two days before the event to the event day. The proximity of these fires to the site suggests they may have contributed to elevated ozone levels on this date. The following wildfires were identified: Rider Fire, which burned 140.00, started on July 21, 2026, and last updated on July 26, 2026. It was located 14.9 miles away. Creelman Fire, which burned 347.00, started on July 22, 2026, and ended on July 25, 2026. It was located 75.5 miles away. Kirby Fire, which burned 46.00, started on July 23, 2026, and last updated on July 26, 2026. It was located 53.7 miles away. Tin Fire, which burned 37.00, started on July 26, 2026, and ended on July 27, 2026. It was located 11.0 miles away. Keller Fire, which burned 10.00, started on July 26, 2026, and ended on July 27, 2026. It was located 29.3 miles away. No prescribed fires were identified within 50 miles of Riverside - Rubidoux. In addition to reported prescribed fire and wildfire records from CAL FIRE and the Prescribed Fire Reporting System (PFIRS), satellite imagery detected 59 fire hotspots over the past two days (from two days before the event to the current day) within 100 miles of the site. This indicates ongoing fire activity in the region, which may have contributed to the observed air quality conditions. Satellite data confirms the presence of smoke plumes over the monitoring site, suggesting that emissions from nearby fires were transported into the area, potentially impacting ozone levels. |
| 060658005 | On July 27, 2026, an analysis was conducted to assess the potential impact of nearby fire activity on ozone levels at Mira Loma - Van Buren. 5 wildfires were detected within 100 miles of the site from two days before the event to the event day. The proximity of these fires to the site suggests they may have contributed to elevated ozone levels on this date. The following wildfires were identified: Rider Fire, which burned 140.00, started on July 21, 2026, and last updated on July 26, 2026. It was located 17.6 miles away. Creelman Fire, which burned 347.00, started on July 22, 2026, and ended on July 25, 2026. It was located 77.4 miles away. Kirby Fire, which burned 46.00, started on July 23, 2026, and last updated on July 26, 2026. It was located 57.3 miles away. Tin Fire, which burned 37.00, started on July 26, 2026, and ended on July 27, 2026. It was located 10.6 miles away. Keller Fire, which burned 10.00, started on July 26, 2026, and ended on July 27, 2026. It was located 31.5 miles away. No prescribed fires were identified within 50 miles of Mira Loma - Van Buren. In addition to reported prescribed fire and wildfire records from CAL FIRE and the Prescribed Fire Reporting System (PFIRS), satellite imagery detected 59 fire hotspots over the past two days (from two days before the event to the current day) within 100 miles of the site. This indicates ongoing fire activity in the region, which may have contributed to the observed air quality conditions. Satellite data confirms the presence of smoke plumes over the monitoring site, suggesting that emissions from nearby fires were transported into the area, potentially impacting ozone levels. |
| 060712002 | On July 27, 2026, an analysis was conducted to assess the potential impact of nearby fire activity on ozone levels at Fontana - Arrow Highway. 5 wildfires were detected within 100 miles of the site from two days before the event to the event day. The proximity of these fires to the site suggests they may have contributed to elevated ozone levels on this date. The following wildfires were identified: Rider Fire, which burned 140.00, started on July 21, 2026, and last updated on July 26, 2026. It was located 23.1 miles away. Creelman Fire, which burned 347.00, started on July 22, 2026, and ended on July 25, 2026. It was located 83.7 miles away. Kirby Fire, which burned 46.00, started on July 23, 2026, and last updated on July 26, 2026. It was located 61.3 miles away. Tin Fire, which burned 37.00, started on July 26, 2026, and ended on July 27, 2026. It was located 17.7 miles away. Keller Fire, which burned 10.00, started on July 26, 2026, and ended on July 27, 2026. It was located 37.5 miles away. No prescribed fires were identified within 50 miles of Fontana - Arrow Highway. In addition to reported prescribed fire and wildfire records from CAL FIRE and the Prescribed Fire Reporting System (PFIRS), satellite imagery detected 63 fire hotspots over the past two days (from two days before the event to the current day) within 100 miles of the site. This indicates ongoing fire activity in the region, which may have contributed to the observed air quality conditions. Satellite data confirms the presence of smoke plumes over the monitoring site, suggesting that emissions from nearby fires were transported into the area, potentially impacting ozone levels. |
| 060719004 | On July 27, 2026, an analysis was conducted to assess the potential impact of nearby fire activity on ozone levels at San Bernadino - 4th Street. 5 wildfires were detected within 100 miles of the site from two days before the event to the event day. The proximity of these fires to the site suggests they may have contributed to elevated ozone levels on this date. The following wildfires were identified: Rider Fire, which burned 140.00, started on July 21, 2026, and last updated on July 26, 2026. It was located 19.5 miles away. Creelman Fire, which burned 347.00, started on July 22, 2026, and ended on July 25, 2026. It was located 79.3 miles away. Kirby Fire, which burned 46.00, started on July 23, 2026, and last updated on July 26, 2026. It was located 52.4 miles away. Tin Fire, which burned 37.00, started on July 26, 2026, and ended on July 27, 2026. It was located 21.1 miles away. Keller Fire, which burned 10.00, started on July 26, 2026, and ended on July 27, 2026. It was located 33.7 miles away. No prescribed fires were identified within 50 miles of San Bernadino - 4th Street. In addition to reported prescribed fire and wildfire records from CAL FIRE and the Prescribed Fire Reporting System (PFIRS), satellite imagery detected 59 fire hotspots over the past two days (from two days before the event to the current day) within 100 miles of the site. This indicates ongoing fire activity in the region, which may have contributed to the observed air quality conditions. Satellite data confirms the presence of smoke plumes over the monitoring site, suggesting that emissions from nearby fires were transported into the area, potentially impacting ozone levels. |
| 060372005 | On July 27, 2026, an analysis was conducted to assess the potential impact of nearby fire activity on ozone levels at Pasadena. 5 wildfires were detected within 100 miles of the site from two days before the event to the event day. The proximity of these fires to the site suggests they may have contributed to elevated ozone levels on this date. The following wildfires were identified: Rider Fire, which burned 140.00, started on July 21, 2026, and last updated on July 26, 2026. It was located 53.8 miles away. Kirby Fire, which burned 46.00, started on July 23, 2026, and last updated on July 26, 2026. It was located 93.8 miles away. Tin Fire, which burned 37.00, started on July 26, 2026, and ended on July 27, 2026. It was located 42.9 miles away. Keller Fire, which burned 10.00, started on July 26, 2026, and ended on July 27, 2026. It was located 65.0 miles away. Fish Fire, which burned 4201.00, started on July 27, 2026, and last updated on July 29, 2026. It was located 86.5 miles away. No prescribed fires were identified within 50 miles of Pasadena. In addition to reported prescribed fire and wildfire records from CAL FIRE and the Prescribed Fire Reporting System (PFIRS), satellite imagery detected 744 fire hotspots over the past two days (from two days before the event to the current day) within 100 miles of the site. This indicates ongoing fire activity in the region, which may have contributed to the observed air quality conditions. Satellite data confirms the presence of smoke plumes over the monitoring site, suggesting that emissions from nearby fires were transported into the area, potentially impacting ozone levels. |
| 060710005 | On July 27, 2026, an analysis was conducted to assess the potential impact of nearby fire activity on ozone levels at Crestline - Lake Gregory. 5 wildfires were detected within 100 miles of the site from two days before the event to the event day. The proximity of these fires to the site suggests they may have contributed to elevated ozone levels on this date. The following wildfires were identified: Rider Fire, which burned 140.00, started on July 21, 2026, and last updated on July 26, 2026. It was located 28.9 miles away. Creelman Fire, which burned 347.00, started on July 22, 2026, and ended on July 25, 2026. It was located 88.3 miles away. Kirby Fire, which burned 46.00, started on July 23, 2026, and last updated on July 26, 2026. It was located 59.5 miles away. Tin Fire, which burned 37.00, started on July 26, 2026, and ended on July 27, 2026. It was located 29.6 miles away. Keller Fire, which burned 10.00, started on July 26, 2026, and ended on July 27, 2026. It was located 43.0 miles away. No prescribed fires were identified within 50 miles of Crestline - Lake Gregory. In addition to reported prescribed fire and wildfire records from CAL FIRE and the Prescribed Fire Reporting System (PFIRS), satellite imagery detected 59 fire hotspots over the past two days (from two days before the event to the current day) within 100 miles of the site. This indicates ongoing fire activity in the region, which may have contributed to the observed air quality conditions. Satellite data confirms the presence of smoke plumes over the monitoring site, suggesting that emissions from nearby fires were transported into the area, potentially impacting ozone levels. |
| 160230101 | No wildfires were identified within 100 miles of Craters of the Moon NM. No prescribed fires were identified within 50 miles of Craters of the Moon NM. While no prescribed fires or wildfires were recorded from CAL FIRE and the Prescribed Fire Reporting System (PFIRS), |
| 060710306 | On July 27, 2026, an analysis was conducted to assess the potential impact of nearby fire activity on ozone levels at Victorville - Park Avenue. 5 wildfires were detected within 100 miles of the site from two days before the event to the event day. The proximity of these fires to the site suggests they may have contributed to elevated ozone levels on this date. The following wildfires were identified: Rider Fire, which burned 140.00, started on July 21, 2026, and last updated on July 26, 2026. It was located 47.5 miles away. Kirby Fire, which burned 46.00, started on July 23, 2026, and last updated on July 26, 2026. It was located 76.6 miles away. Tin Fire, which burned 37.00, started on July 26, 2026, and ended on July 27, 2026. It was located 46.7 miles away. Keller Fire, which burned 10.00, started on July 26, 2026, and ended on July 27, 2026. It was located 61.7 miles away. Fish Fire, which burned 4201.00, started on July 27, 2026, and last updated on July 29, 2026. It was located 93.7 miles away. No prescribed fires were identified within 50 miles of Victorville - Park Avenue. In addition to reported prescribed fire and wildfire records from CAL FIRE and the Prescribed Fire Reporting System (PFIRS), satellite imagery detected 716 fire hotspots over the past two days (from two days before the event to the current day) within 100 miles of the site. This indicates ongoing fire activity in the region, which may have contributed to the observed air quality conditions. Satellite data confirms the presence of smoke plumes over the monitoring site, suggesting that emissions from nearby fires were transported into the area, potentially impacting ozone levels. |
| 060714001 | On July 27, 2026, an analysis was conducted to assess the potential impact of nearby fire activity on ozone levels at Hesperia - Olive Street. 5 wildfires were detected within 100 miles of the site from two days before the event to the event day. The proximity of these fires to the site suggests they may have contributed to elevated ozone levels on this date. The following wildfires were identified: Rider Fire, which burned 140.00, started on July 21, 2026, and last updated on July 26, 2026. It was located 40.9 miles away. Kirby Fire, which burned 46.00, started on July 23, 2026, and last updated on July 26, 2026. It was located 69.8 miles away. Tin Fire, which burned 37.00, started on July 26, 2026, and ended on July 27, 2026. It was located 40.8 miles away. Keller Fire, which burned 10.00, started on July 26, 2026, and ended on July 27, 2026. It was located 54.9 miles away. Fish Fire, which burned 4201.00, started on July 27, 2026, and last updated on July 29, 2026. It was located 99.5 miles away. No prescribed fires were identified within 50 miles of Hesperia - Olive Street. In addition to reported prescribed fire and wildfire records from CAL FIRE and the Prescribed Fire Reporting System (PFIRS), satellite imagery detected 659 fire hotspots over the past two days (from two days before the event to the current day) within 100 miles of the site. This indicates ongoing fire activity in the region, which may have contributed to the observed air quality conditions. Satellite data confirms the presence of smoke plumes over the monitoring site, suggesting that emissions from nearby fires were transported into the area, potentially impacting ozone levels. |
High-Split Trajectory for Ozone Exceedance Monitor Site
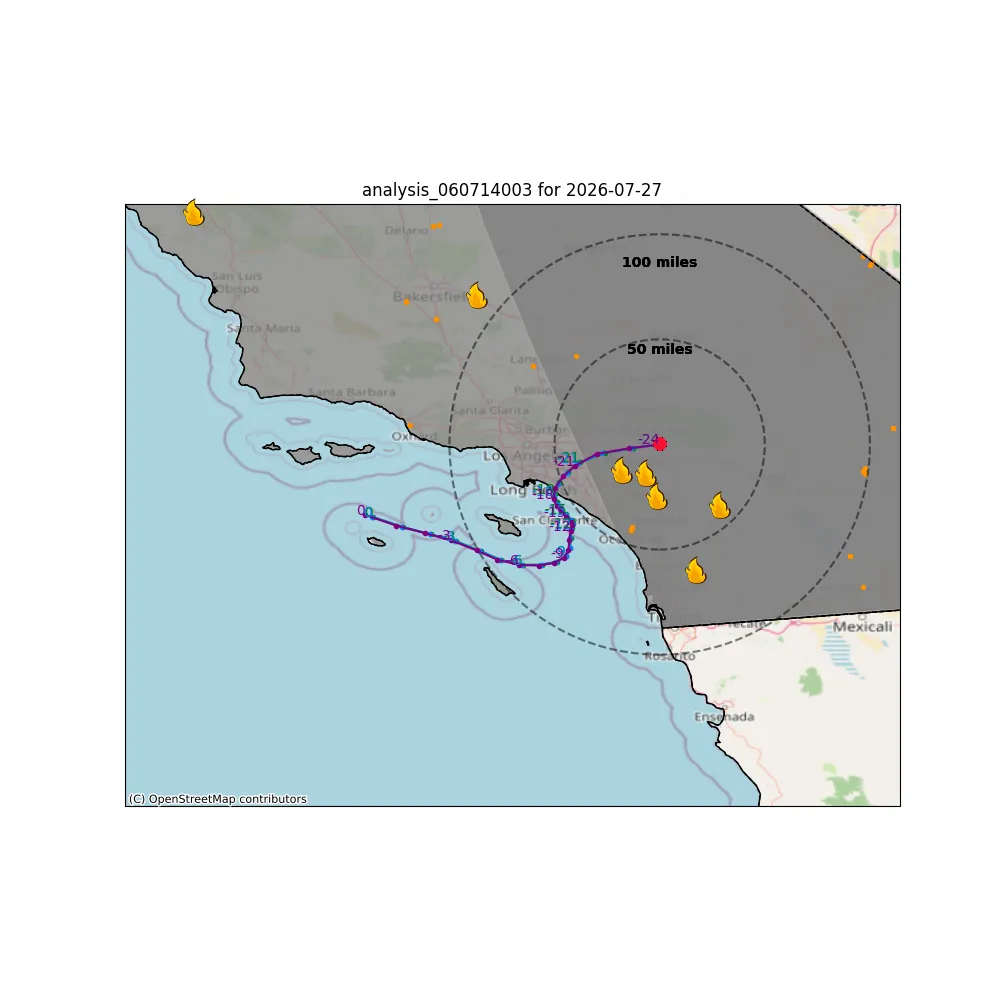
HYSPLIT 24-hour Backward Trajectories from the Redlands - Dearborn site (060714003) at 100, 150, and 200 meters above ground level, initiated at the highest hourly concentration on July 27, 2026.
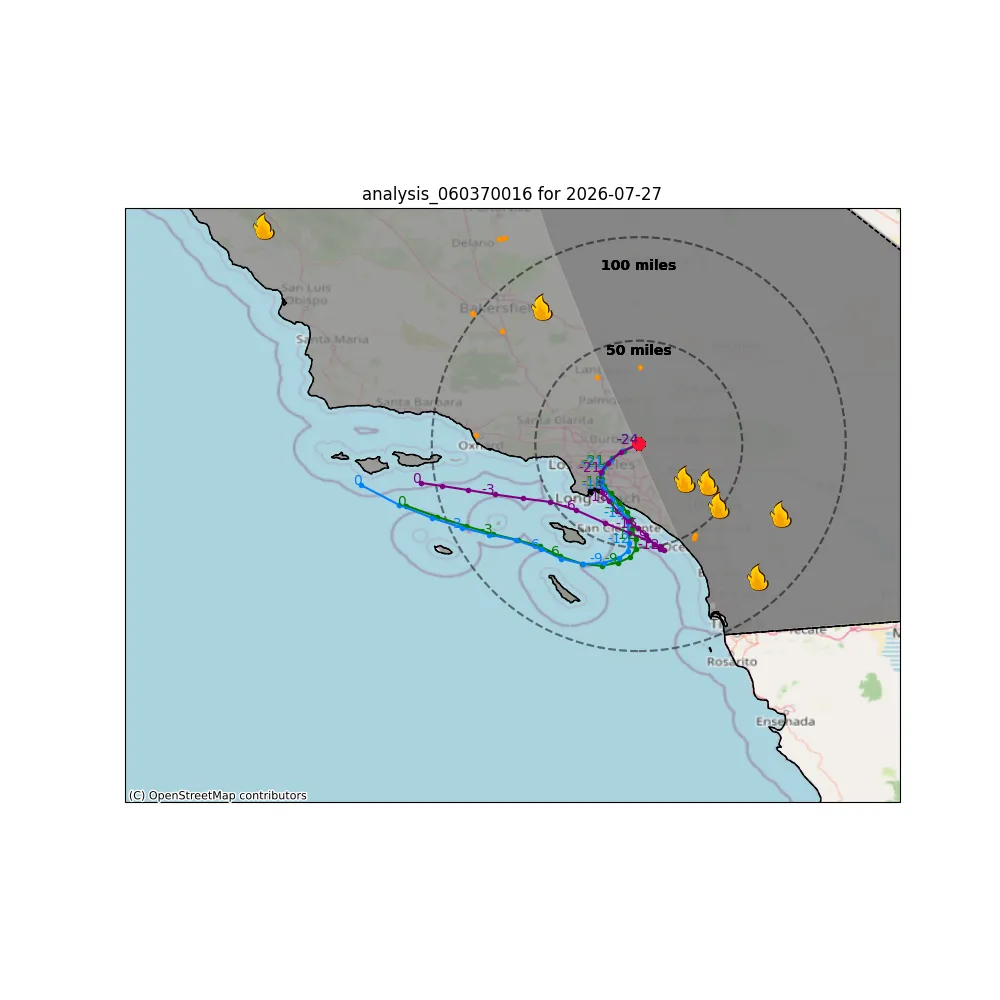
HYSPLIT 24-hour Backward Trajectories from the Glendora - Laurel site (060370016) at 100, 150, and 200 meters above ground level, initiated at the highest hourly concentration on July 27, 2026.
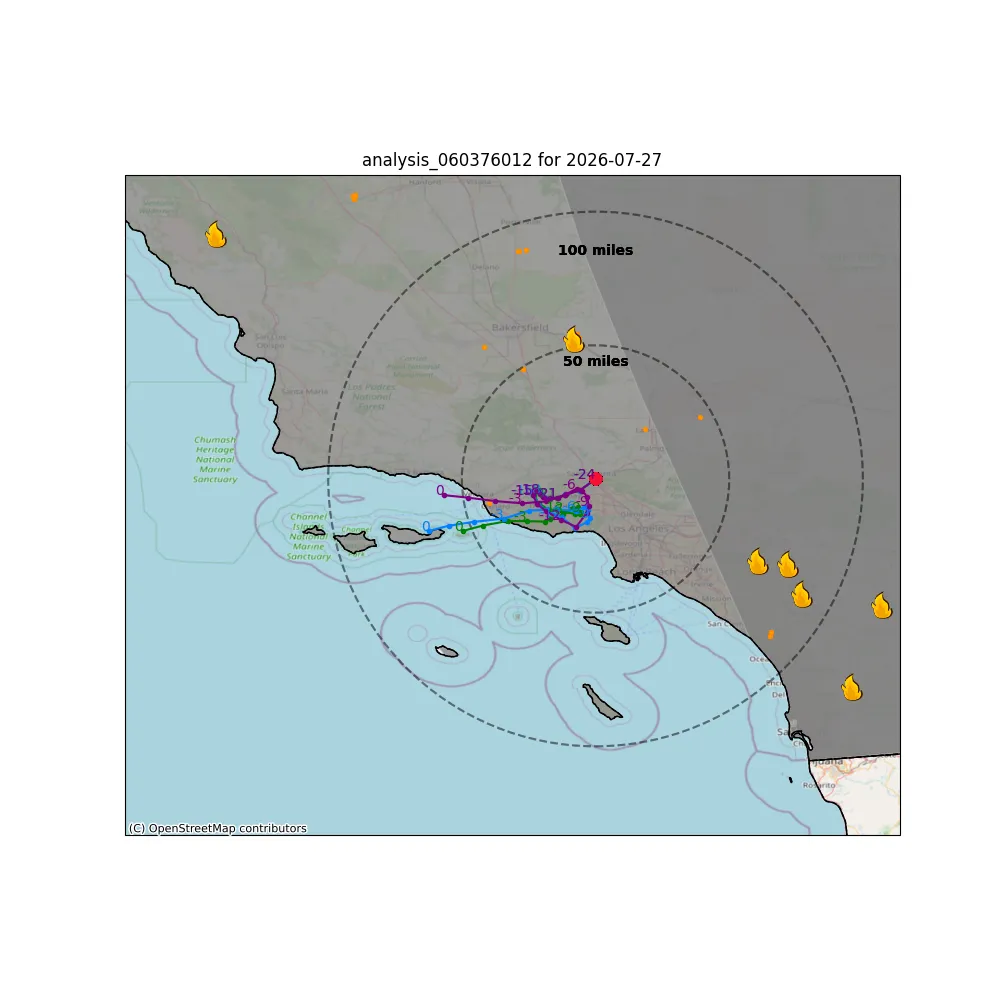
HYSPLIT 24-hour Backward Trajectories from the Santa Clarita site (060376012) at 100, 150, and 200 meters above ground level, initiated at the highest hourly concentration on July 27, 2026.
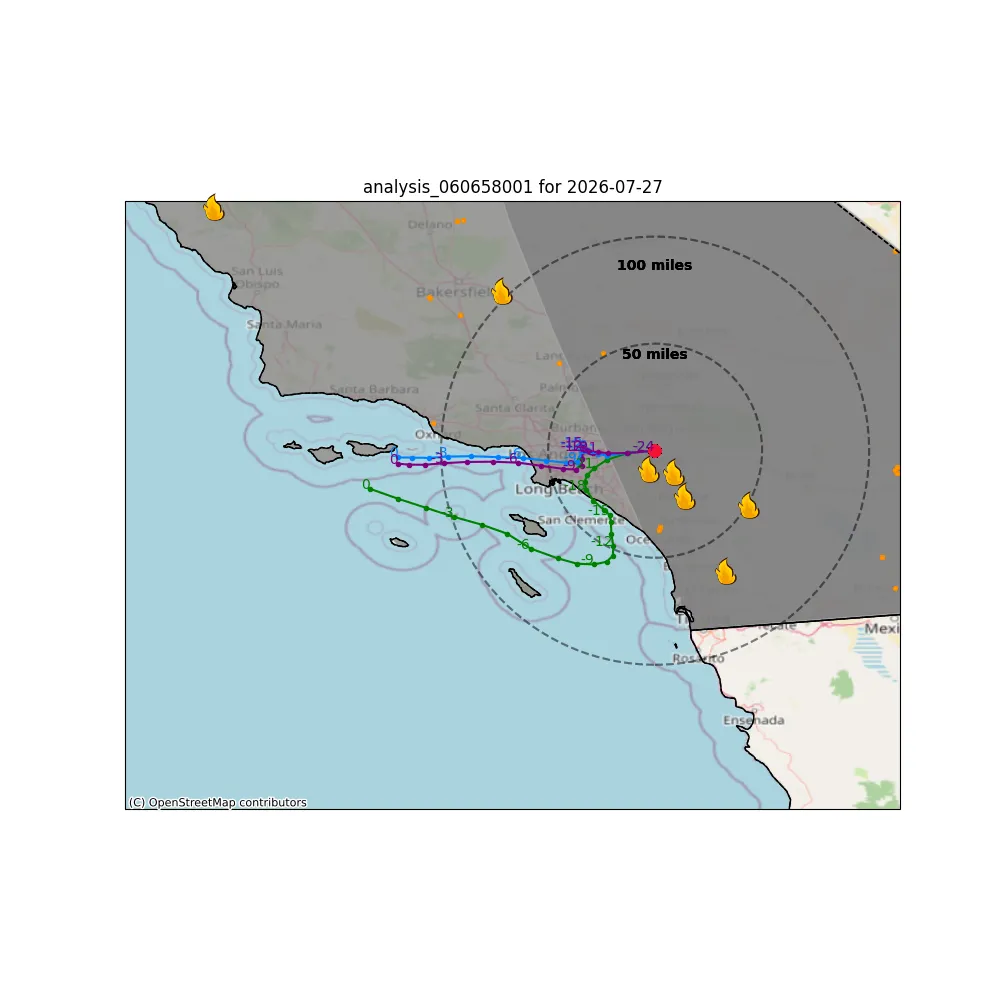
HYSPLIT 24-hour Backward Trajectories from the Riverside - Rubidoux site (060658001) at 100, 150, and 200 meters above ground level, initiated at the highest hourly concentration on July 27, 2026.
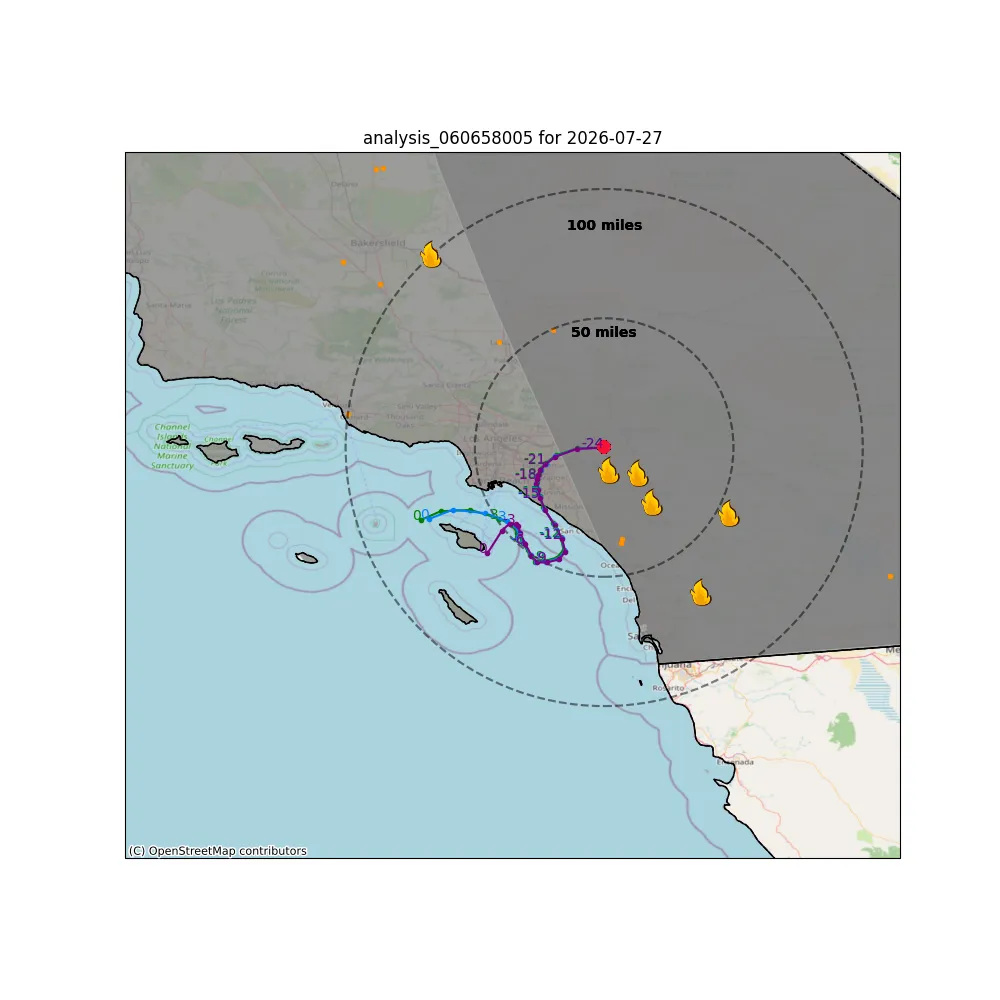
HYSPLIT 24-hour Backward Trajectories from the Mira Loma - Van Buren site (060658005) at 100, 150, and 200 meters above ground level, initiated at the highest hourly concentration on July 27, 2026.
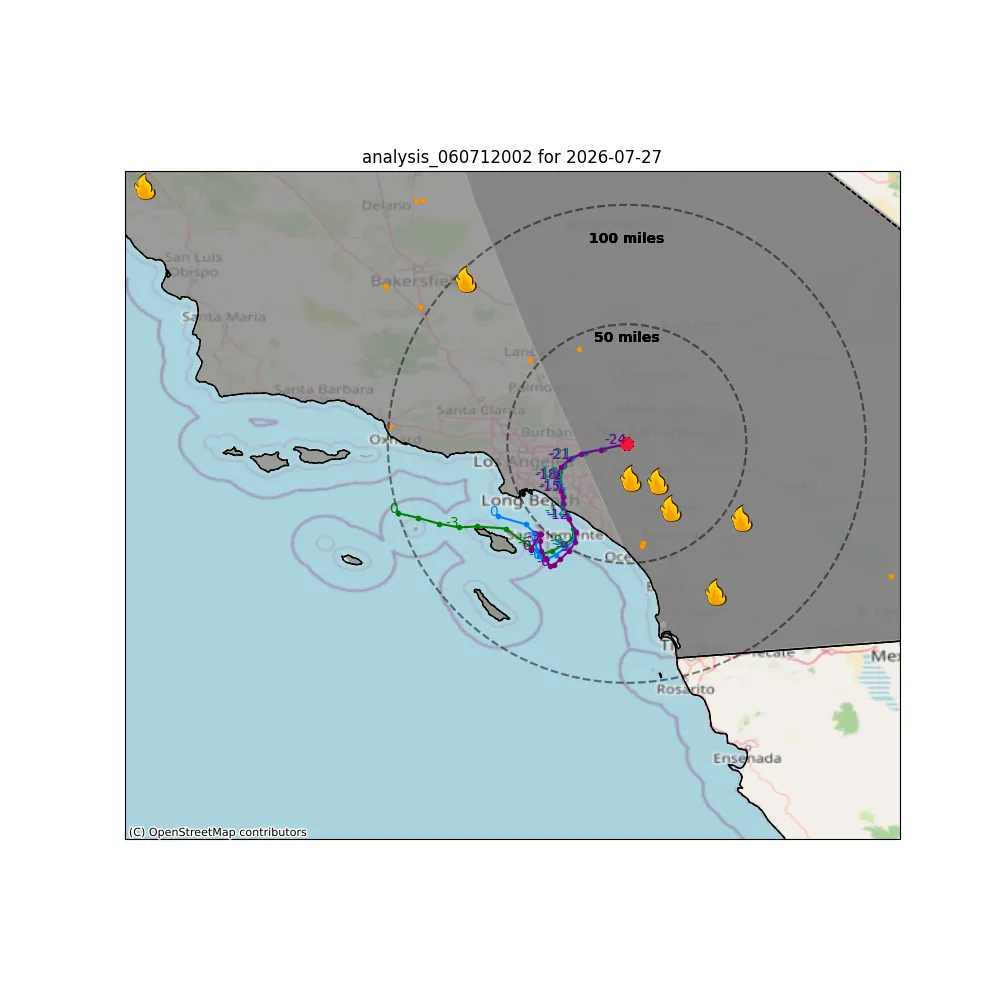
HYSPLIT 24-hour Backward Trajectories from the Fontana - Arrow Highway site (060712002) at 100, 150, and 200 meters above ground level, initiated at the highest hourly concentration on July 27, 2026.
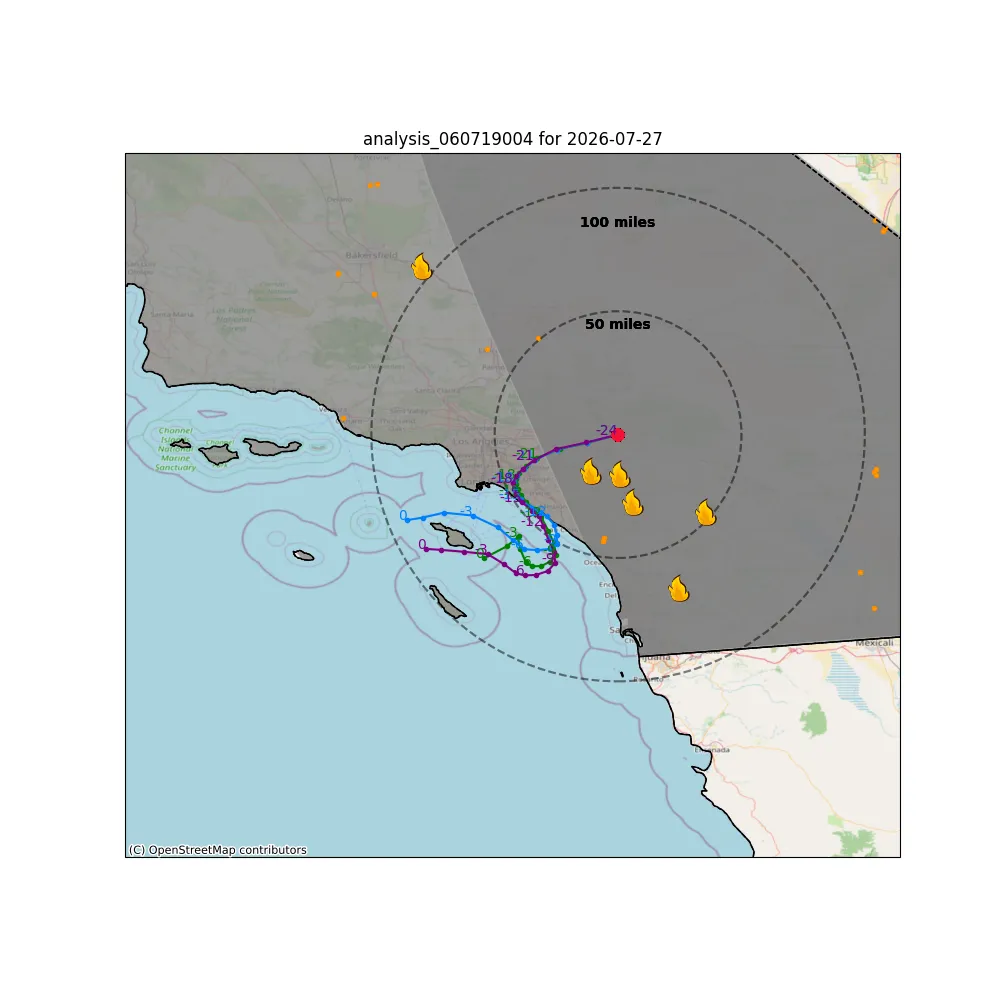
HYSPLIT 24-hour Backward Trajectories from the San Bernadino - 4th Street site (060719004) at 100, 150, and 200 meters above ground level, initiated at the highest hourly concentration on July 27, 2026.
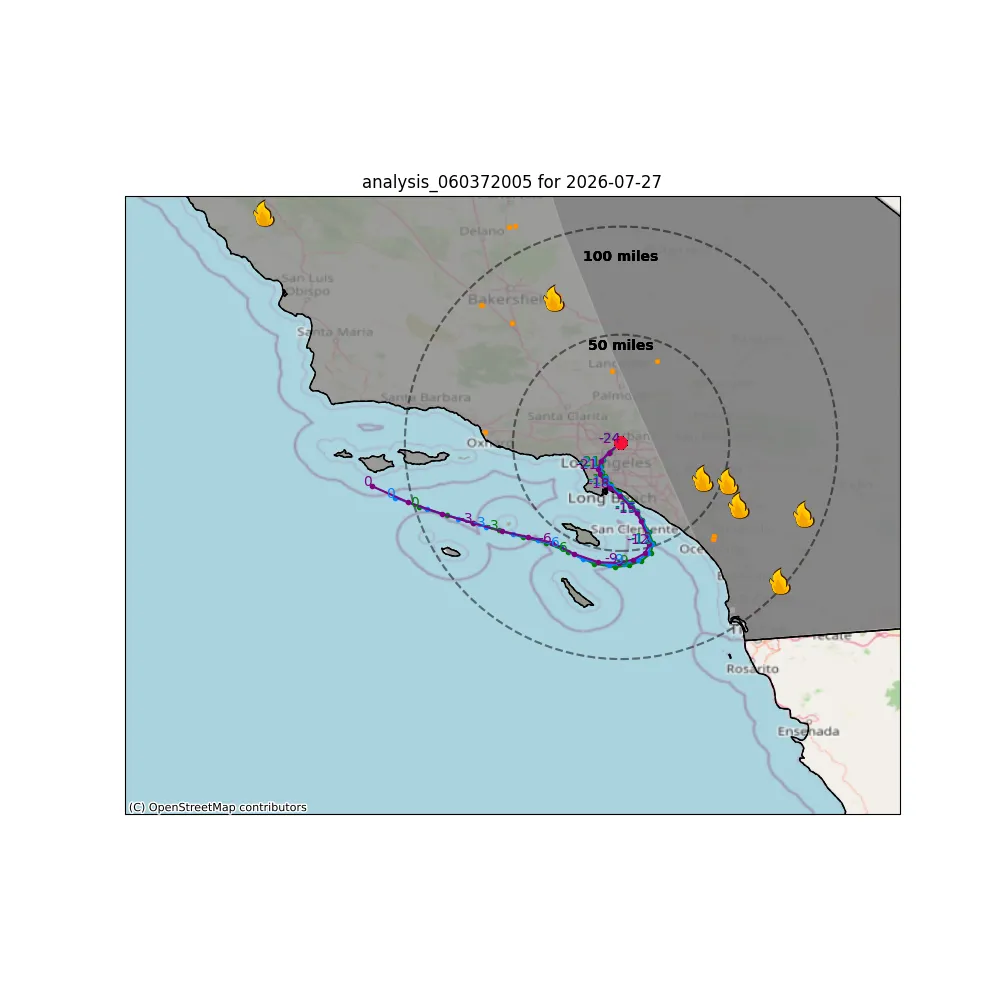
HYSPLIT 24-hour Backward Trajectories from the Pasadena site (060372005) at 100, 150, and 200 meters above ground level, initiated at the highest hourly concentration on July 27, 2026.
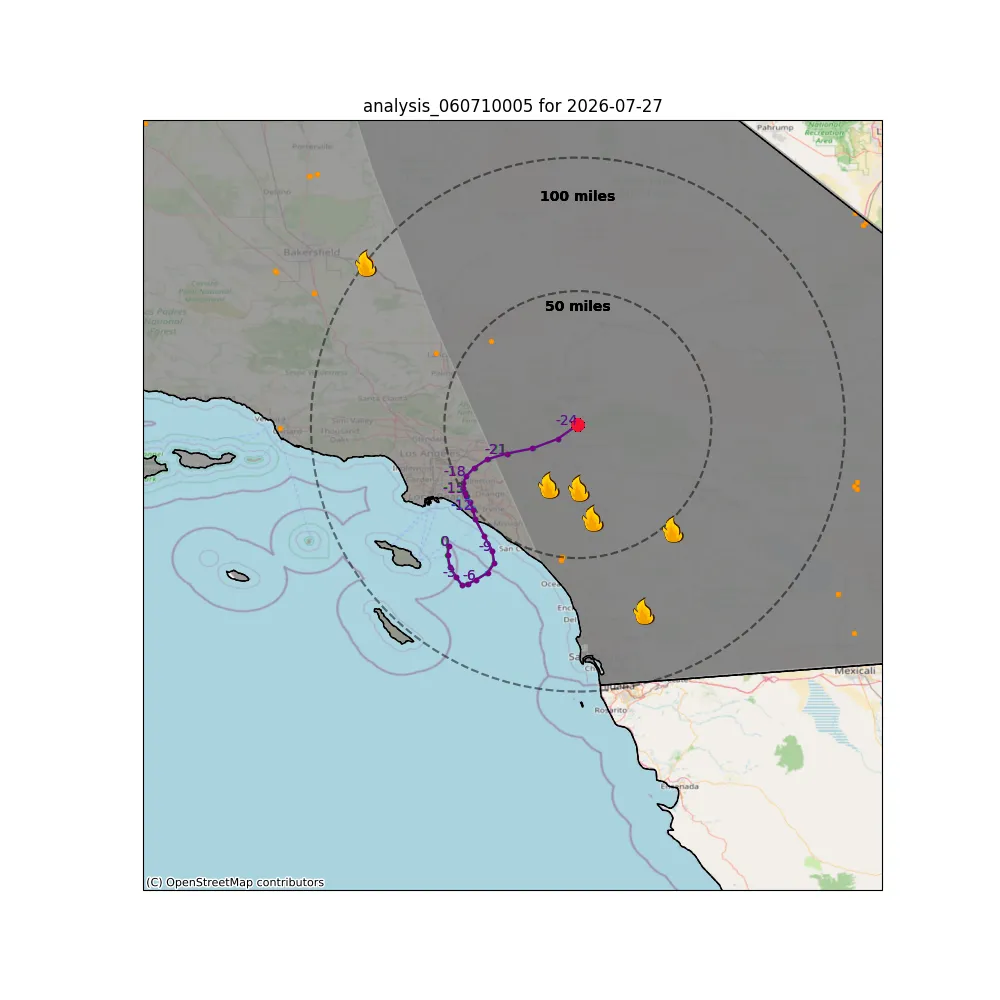
HYSPLIT 24-hour Backward Trajectories from the Crestline - Lake Gregory site (060710005) at 100, 150, and 200 meters above ground level, initiated at the highest hourly concentration on July 27, 2026.
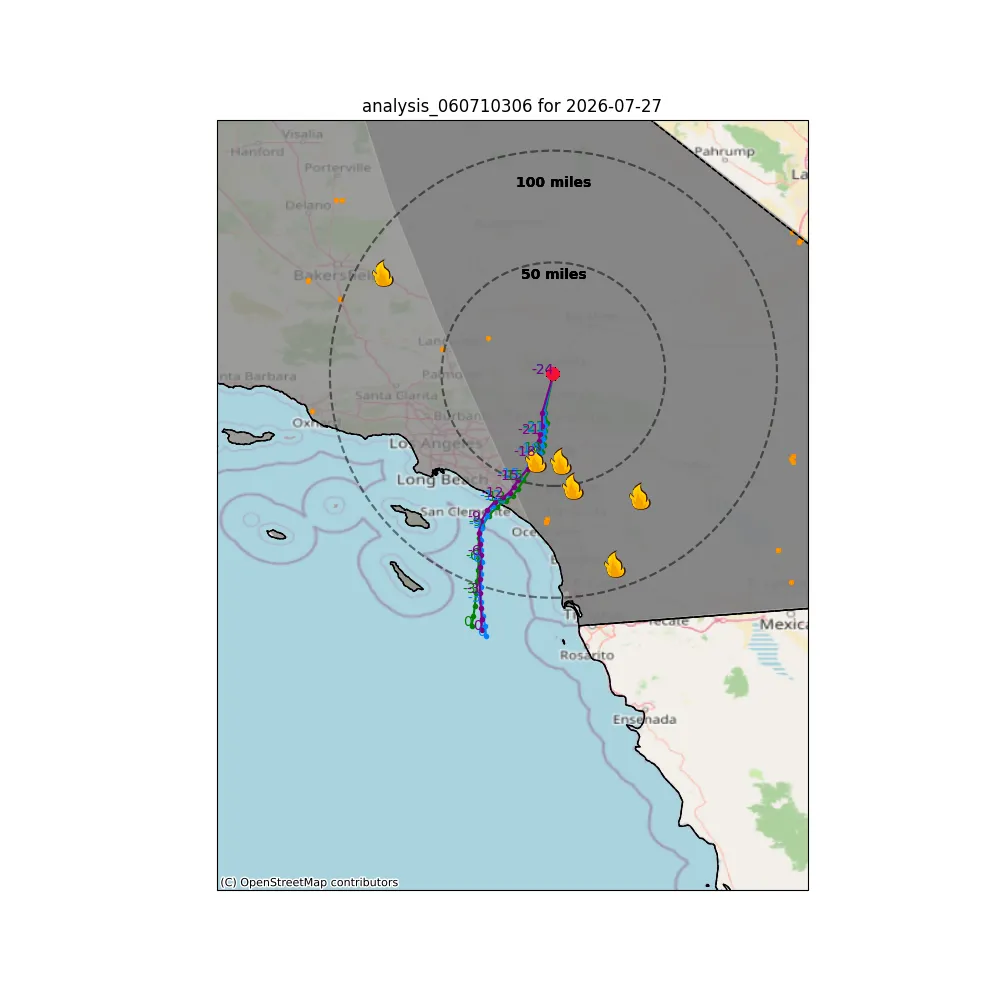
HYSPLIT 24-hour Backward Trajectories from the Victorville - Park Avenue site (060710306) at 100, 150, and 200 meters above ground level, initiated at the highest hourly concentration on July 27, 2026.
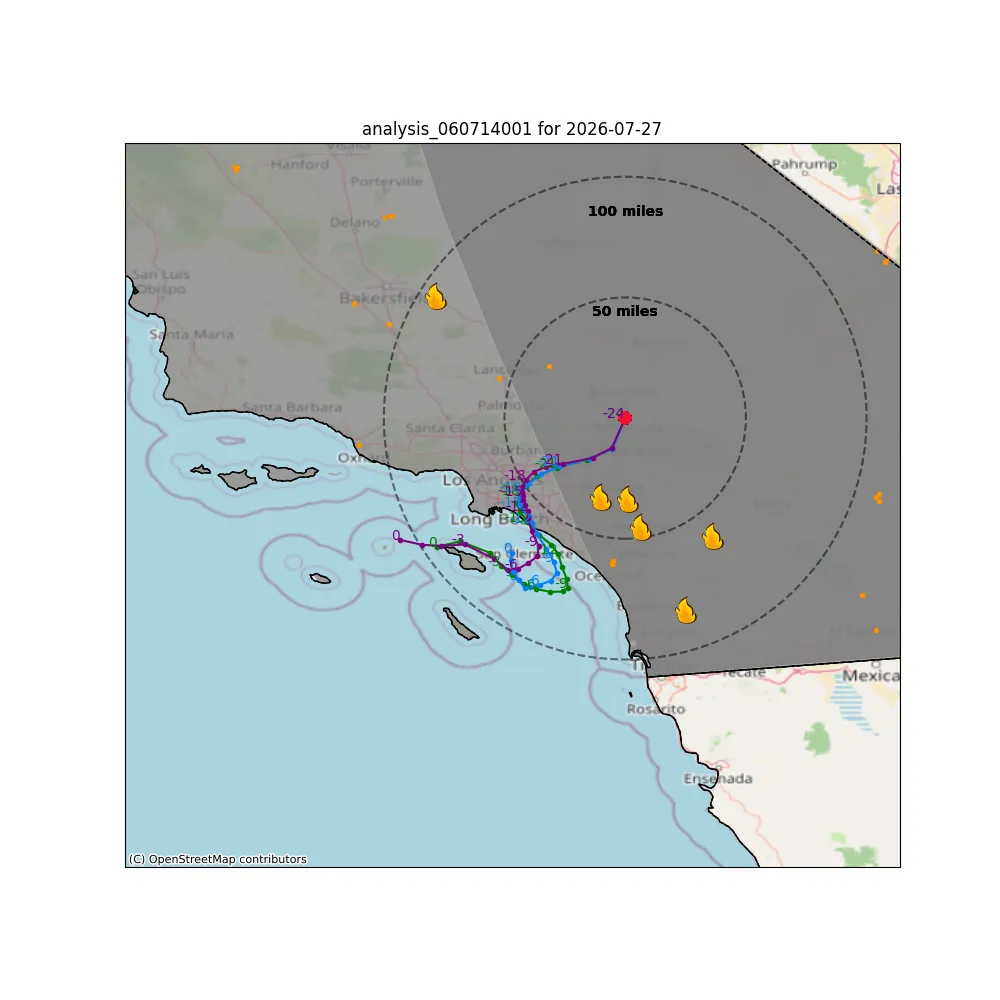
HYSPLIT 24-hour Backward Trajectories from the Hesperia - Olive Street site (060714001) at 100, 150, and 200 meters above ground level, initiated at the highest hourly concentration on July 27, 2026.