Initial Exceedance Analysis for Oct. 17, 2023
Monitors Exceeding PM2.5 Concentration of 35
| Monitor AQS ID | Site Name | Location (Lat, Long) | PM2.5 Value | AQI Category |
|---|---|---|---|---|
| 840060199999 | Pinehurst | 36.70, -119.02 | 77.2 | Unhealthy |
| 060431001 | Yosemite Village - Visitor Center | 37.75, -119.59 | 45.2 | Sensitive Group |
Air Quality Analysis
| Monitor AQS ID | Air Quality Analysis |
|---|---|
| 840060199999 | Hourly PM2.5 Analysis At Pinehurst, hourly PM2.5 concentrations showed a decreasing trend on October 17 and October 18. PM2.5 levels exceeded 35 µg/m³ on 32 occasions, occurring at: October 17, 12:00 AM, October 17, 01:00 AM, October 17, 02:00 AM, October 17, 03:00 AM, October 17, 04:00 AM, October 17, 05:00 AM, October 17, 06:00 AM, October 17, 07:00 AM, October 17, 08:00 AM, October 17, 09:00 AM, October 17, 10:00 AM, October 17, 07:00 PM, October 17, 08:00 PM, October 17, 09:00 PM, October 17, 10:00 PM, October 17, 11:00 PM, October 18, 12:00 AM, October 18, 01:00 AM, October 18, 02:00 AM, October 18, 03:00 AM, October 18, 04:00 AM, October 18, 05:00 AM, October 18, 06:00 AM, October 18, 07:00 AM, October 18, 08:00 AM, October 18, 09:00 AM, October 18, 10:00 AM, October 18, 07:00 PM, October 18, 08:00 PM, October 18, 09:00 PM, October 18, 10:00 PM, October 18, 11:00 PM. Among these exceedances, 7 were significant pollution spikes (peaks), recorded at: October 17, 03:00 AM, October 17, 06:00 AM, October 17, 10:00 PM, October 18, 12:00 AM, October 18, 06:00 AM, October 18, 09:00 AM, October 18, 08:00 PM. Hourly PM2.5 levels showed a distinct day-night pattern. The highest recorded PM2.5 concentration was 151.8 µg/m³ at October 17, 06:00 AM, while the lowest was 7.2 µg/m³ at October 18, 05:00 PM. Unusual PM2.5 spikes detected at: October 17, 12:00 AM, October 17, 06:00 AM, October 17, 07:00 AM. Daily PM2.5 Analysis of the Year Throughout 2023, PM2.5 levels at Pinehurst exceeded 35 µg/m³ on 24 days, which accounts for 6.6% of the year. On October 17, 2023, the PM2.5 concentration reached 77.2 µg/m³, ranking #8 among exceedance events this year. The highest PM2.5 exceedance this year was 118.9 µg/m³ on October 14, 2023, which was 41.7 µg/m³ higher than this event. The majority of exceedance events occurred in October, with 18 occurrences. The season with the highest exceedance frequency was Fall, accounting for 24 exceedance days. Historical daily PM2.5 Analysis Between 2019 and 2023, PM2.5 levels at Pinehurst exceeded the 35 µg/m³ daily standard most frequently during Summer, accounting for 32.6% of all exceedances. The month with the highest number of exceedances was July, making up 11.4% of the total. The exceedance recorded on October 17, 2023 at Pinehurst reached 77.2 µg/m³, which is 68.3 µg/m³ higher than the average Summer PM2.5 level of 8.9 µg/m³. This exceedance is notable but does not rank in the top 10 highest exceedances recorded from 2019 to 2023. These exceedances are often influenced by seasonal factors such as wildfires, prescribed burns, stagnant air, temperature inversions, or increased local emissions. |
| 060431001 | Hourly PM2.5 Analysis At Yosemite Village - Visitor Center, hourly PM2.5 concentrations showed no significant trend on October 17 and October 18. PM2.5 levels exceeded 35 µg/m³ on 12 occasions, occurring at: October 17, 11:00 AM, October 17, 12:00 PM, October 17, 01:00 PM, October 17, 02:00 PM, October 17, 03:00 PM, October 17, 04:00 PM, October 17, 05:00 PM, October 17, 06:00 PM, October 17, 07:00 PM, October 17, 08:00 PM, October 17, 09:00 PM, October 17, 10:00 PM. Among these exceedances, 3 were significant pollution spikes (peaks), recorded at: October 17, 01:00 PM, October 17, 06:00 PM, October 17, 10:00 PM. Hourly PM2.5 levels showed a distinct day-night pattern. The highest recorded PM2.5 concentration was 138.0 µg/m³ at October 17, 01:00 PM, while the lowest was 0.0 µg/m³ at October 18, 12:00 PM. Unusual PM2.5 spikes detected at: October 17, 12:00 PM, October 17, 01:00 PM, October 17, 02:00 PM. Daily PM2.5 Analysis of the Year Throughout 2023, PM2.5 levels at Yosemite Village - Visitor Center exceeded 35 µg/m³ on 16 days, which accounts for 4.4% of the year. On October 17, 2023, the PM2.5 concentration reached 45.2 µg/m³, ranking #11 among exceedance events this year. The highest PM2.5 exceedance this year was 189.1 µg/m³ on July 15, 2023, which was 143.9 µg/m³ higher than this event. The majority of exceedance events occurred in July, with 7 occurrences. The season with the highest exceedance frequency was Summer, accounting for 7 exceedance days. Historical daily PM2.5 Analysis Between 2019 and 2023, PM2.5 levels at Yosemite Village - Visitor Center exceeded the 35 µg/m³ daily standard most frequently during Summer, accounting for 27.5% of all exceedances. The month with the highest number of exceedances was May, making up 9.5% of the total. The exceedance recorded on October 17, 2023 at Yosemite Village - Visitor Center reached 45.2 µg/m³, which is 31.9 µg/m³ higher than the average Summer PM2.5 level of 13.3 µg/m³. This exceedance is notable but does not rank in the top 10 highest exceedances recorded from 2019 to 2023. These exceedances are often influenced by seasonal factors such as wildfires, prescribed burns, stagnant air, temperature inversions, or increased local emissions. |
Average Hourly PM2.5 for Days Around Event
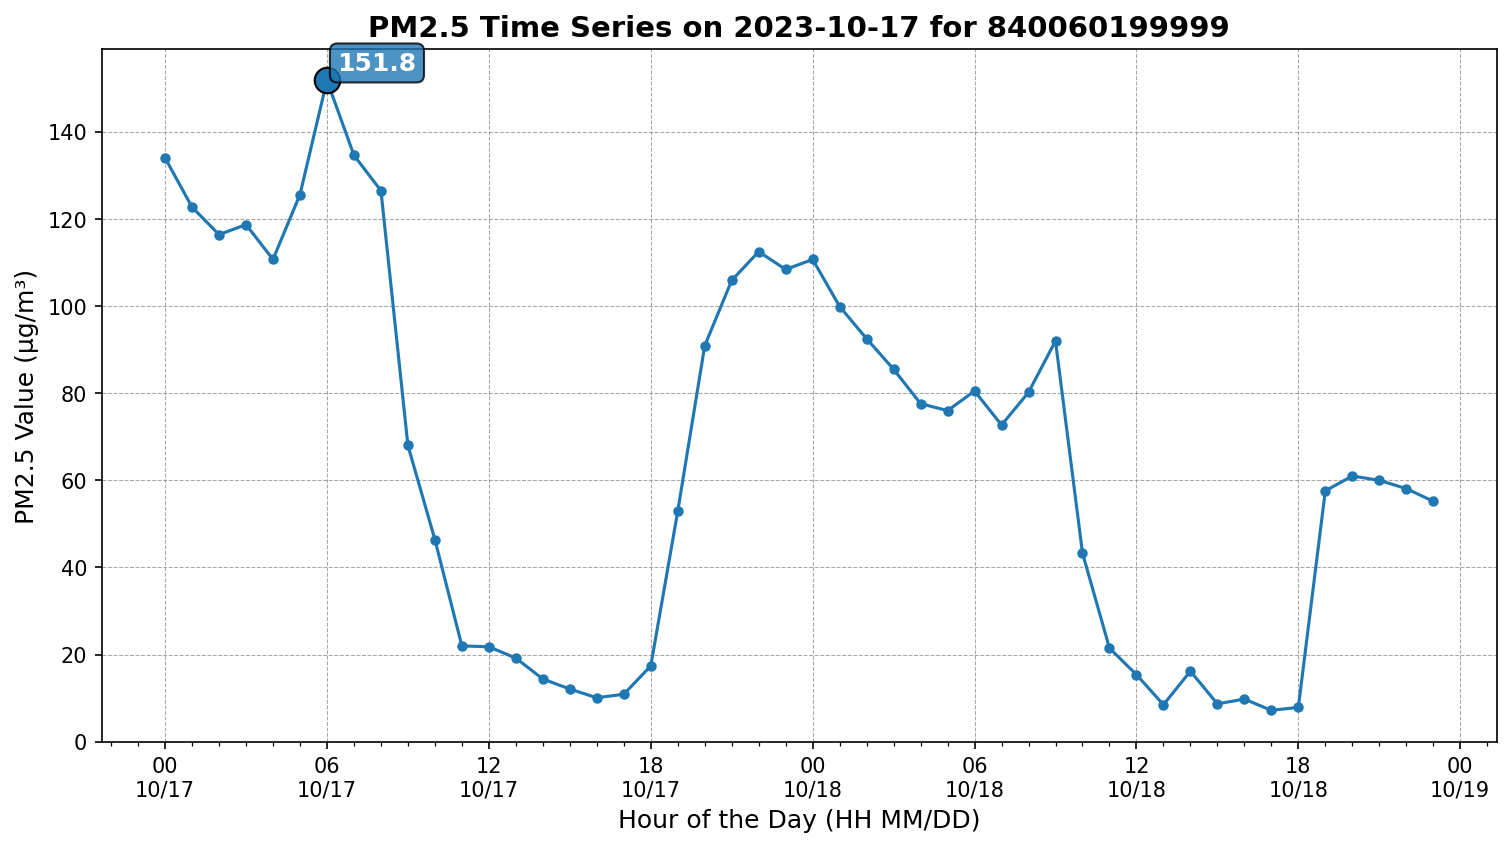
Time series of 1-hour PM2.5 concentrations at Pinehurst starting on Oct. 17, 2023. The number "1" indicates the highest 1-hour PM2.5 concentration of the day, which is also the time used for HYSPLIT backward trajectory analysis.
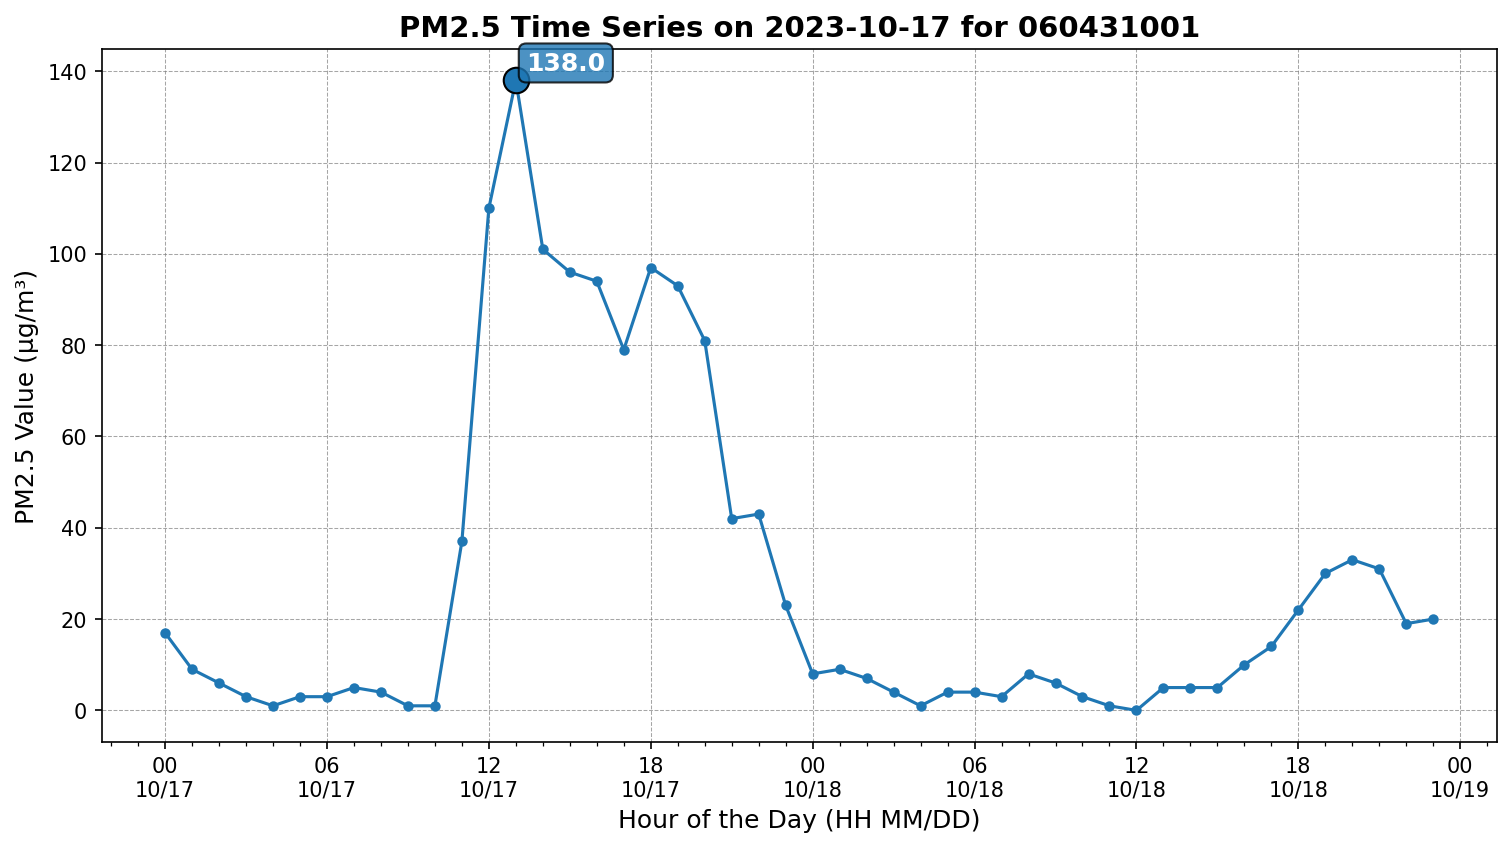
Time series of 1-hour PM2.5 concentrations at Yosemite Village - Visitor Center starting on Oct. 17, 2023. The number "1" indicates the highest 1-hour PM2.5 concentration of the day, which is also the time used for HYSPLIT backward trajectory analysis.
Historical 24-hr PM2.5 Concentration
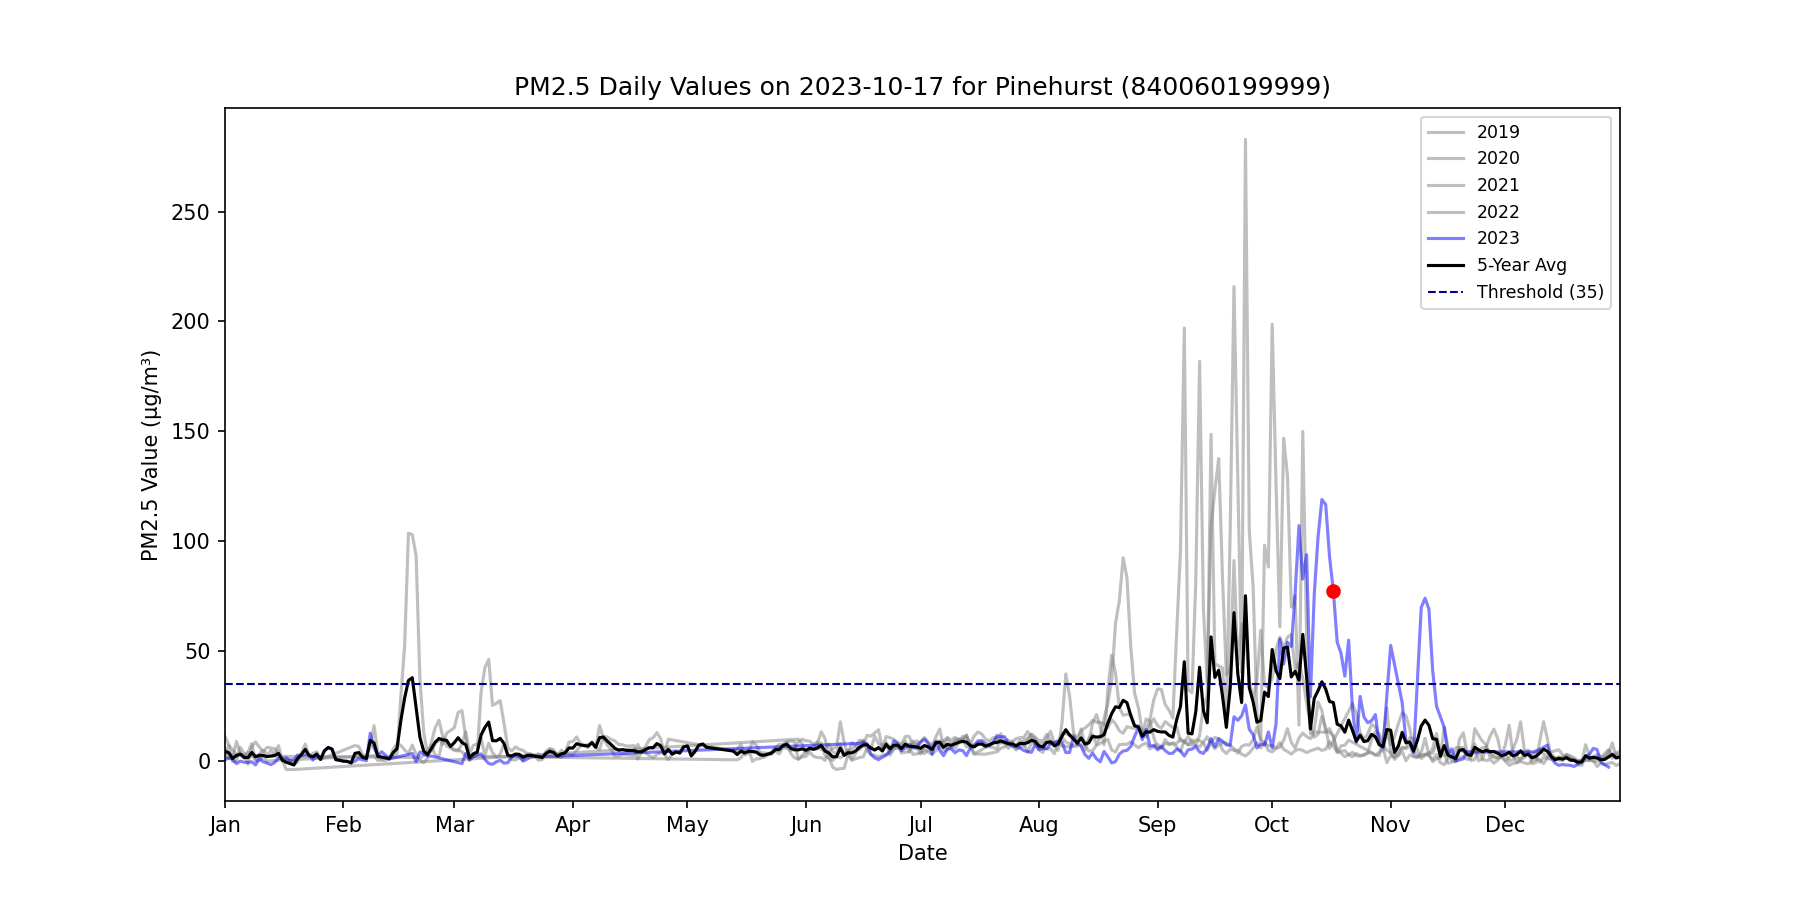
Time series plot of 24-hour PM2.5 concentrations at Pinehurst for each year between 2019 and 2023. The colored dots represent the 24-hour PM2.5 concentrations on Oct. 17, 2023. The black line indicates the 5-year average 24-hour PM2.5 concentration, and the grey dashed line represents the 35 µg/m³ 24-hour PM2.5 standard.
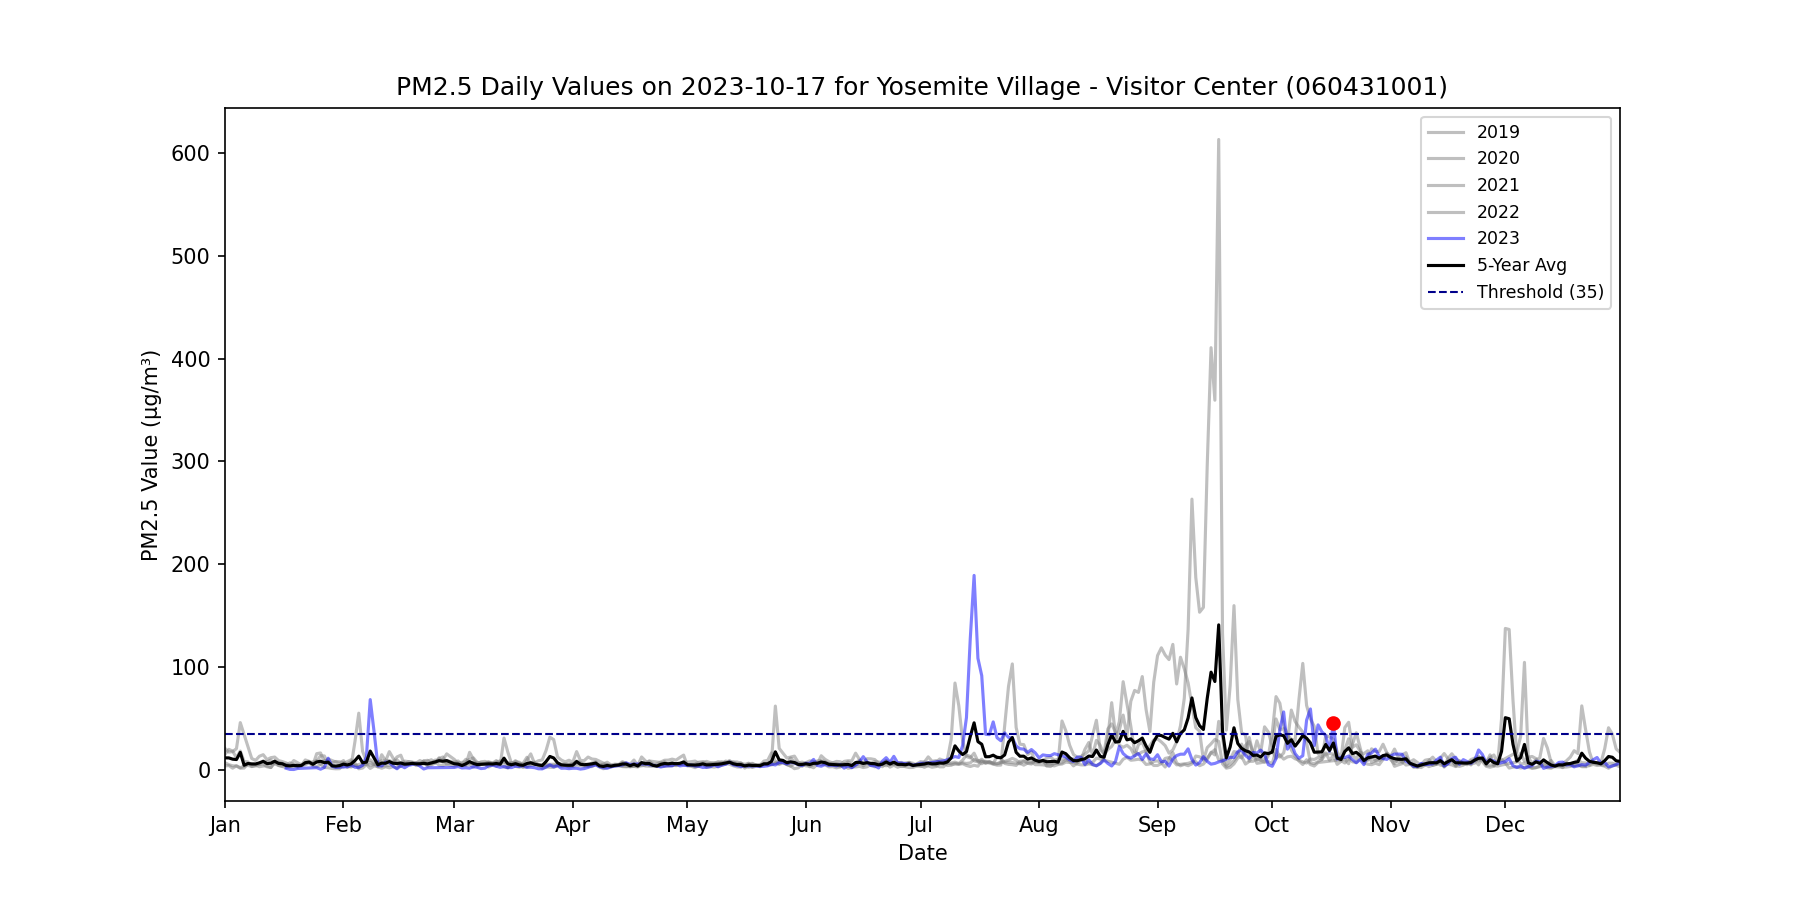
Time series plot of 24-hour PM2.5 concentrations at Yosemite Village - Visitor Center for each year between 2019 and 2023. The colored dots represent the 24-hour PM2.5 concentrations on Oct. 17, 2023. The black line indicates the 5-year average 24-hour PM2.5 concentration, and the grey dashed line represents the 35 µg/m³ 24-hour PM2.5 standard.
Prescribed Fires within 50 Miles
| Monitor AQS ID | On the Day | One Day Before | Two Days Before |
|---|---|---|---|
| 840060199999 |
|
|
|
| 060431001 |
|
|
|
Wildfires within 100 Miles
| Monitor AQS ID | 2-Day Range to Exceedance Date |
|---|---|
| 840060199999 |
|
| 060431001 |
|
Fire Emission Analysis
| Monitor AQS ID | Emission Analysis |
|---|---|
| 840060199999 | On October 17, 2023, an analysis was conducted to assess the potential impact of nearby fire activity on PM2.5 levels at Pinehurst. 4 wildfires were detected within 100 miles of the site from two days before the event to the event day. The proximity of these fires to the site suggests they may have contributed to elevated PM2.5 levels on this date. The following wildfires were identified: RABBIT, which burned 2857.99, started on September 30, 2023, and ended on October 30, 2023. It was located 6.3 miles away. REDWOOD, which burned 2248.45, started on August 15, 2023, and ended on December 14, 2023. It was located 23.0 miles away. SYCAMORE, which burned 23.93, started on October 16, 2023, and ended on October 20, 2023. It was located 17.3 miles away. KING, which burned 118.546, started on October 14, 2023, and ended on October 16, 2023. It was located 40.4 miles away. In addition to these wildfires, 2 prescribed fires were also recorded within the past three days (from two days before the event to the event day). These controlled burns, while intended for land management, may have influenced local air quality. The following prescribed fires were identified: Prescribed Fire ID 103018084, which burned approximately 2.0 acres on 2023-10-17, and was located 47.7 miles away; Prescribed Fire ID 103018083, which burned approximately 3.0 acres on 2023-10-16, and was located 47.7 miles away In addition to reported prescribed fire and wildfire records from CAL FIRE and the Prescribed Fire Reporting System (PFIRS), satellite imagery detected 705 fire hotspots over the past two days (from two days before the event to the current day) within 100 miles of the site. This indicates ongoing fire activity in the region, which may have contributed to the observed air quality conditions. Satellite data confirms the presence of smoke plumes over the monitoring site, suggesting that emissions from nearby fires were transported into the area, potentially impacting PM2.5 levels. |
| 060431001 | On October 17, 2023, an analysis was conducted to assess the potential impact of nearby fire activity on PM2.5 levels at Yosemite Village - Visitor Center. 6 wildfires were detected within 100 miles of the site from two days before the event to the event day. The proximity of these fires to the site suggests they may have contributed to elevated PM2.5 levels on this date. The following wildfires were identified: PEAK, which burned 836.85, started on September 11, 2023, and ended on November 16, 2023. It was located 37.2 miles away. RABBIT, which burned 2857.99, started on September 30, 2023, and ended on October 30, 2023. It was located 79.7 miles away. QUARRY, which burned 8645.43, started on September 09, 2023, and ended on November 08, 2023. It was located 27.6 miles away. REDWOOD, which burned 2248.45, started on August 15, 2023, and ended on December 14, 2023. It was located 98.3 miles away. SYCAMORE, which burned 23.93, started on October 16, 2023, and ended on October 20, 2023. It was located 96.1 miles away. KING, which burned 118.546, started on October 14, 2023, and ended on October 16, 2023. It was located 38.5 miles away. In addition to these wildfires, one prescribed fire was also recorded within the past three days (from two days before the event to the event day). This controlled burn, while intended for land management, may have influenced local air quality. The following prescribed fires were identified: Prescribed Fire ID 103019635, which burned approximately 22.0 acres on 2023-10-17, and was located 4.1 miles away In addition to reported prescribed fire and wildfire records from CAL FIRE and the Prescribed Fire Reporting System (PFIRS), satellite imagery detected 1986 fire hotspots over the past two days (from two days before the event to the current day) within 100 miles of the site. This indicates ongoing fire activity in the region, which may have contributed to the observed air quality conditions. However, satellite imagery does not show clear evidence of smoke reaching the monitoring site. This suggests that further analysis is needed to determine whether other factors contributed to the elevated PM2.5 levels. |
HYSPLIT Trajectory for Exceedance Monitor Site
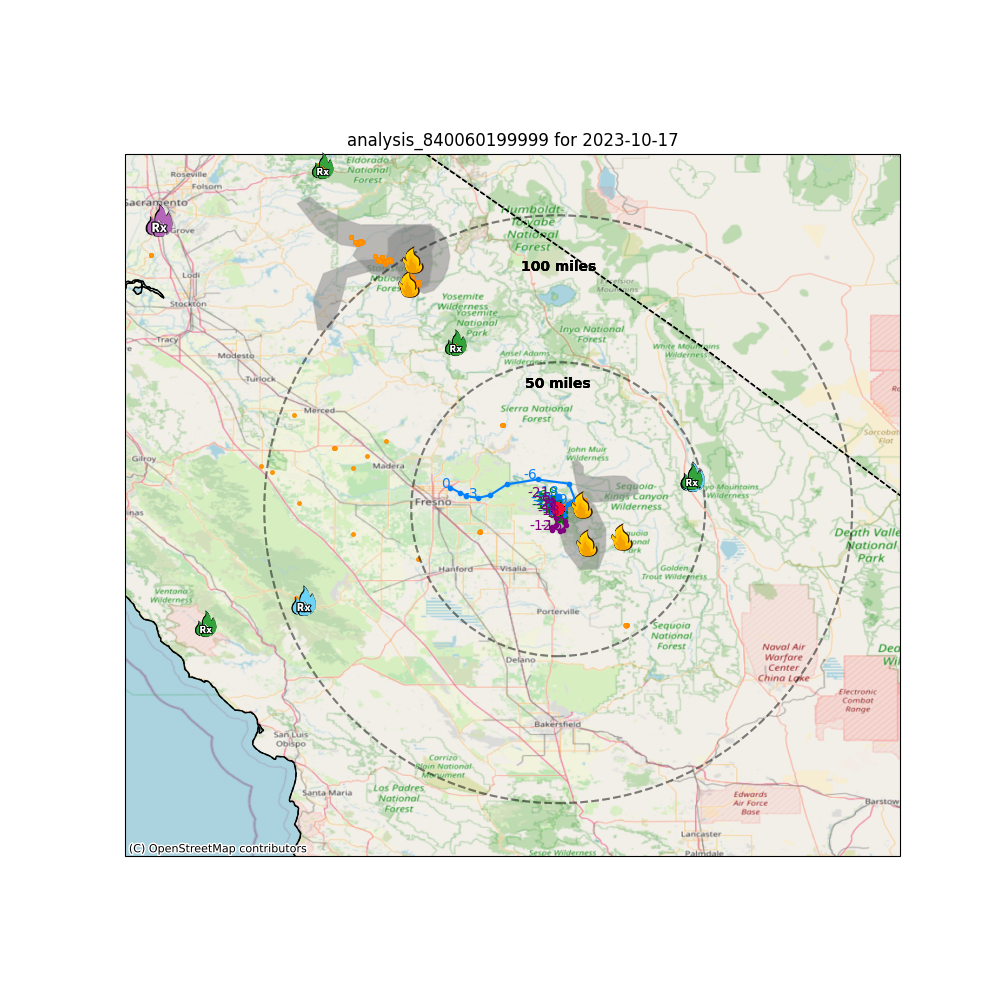
HYSPLIT 24-hour backward trajectories from Pinehurst (840060199999) at 100, 150, and 200 meters above ground level, initiated at the highest hourly concentration on Oct. 17, 2023.
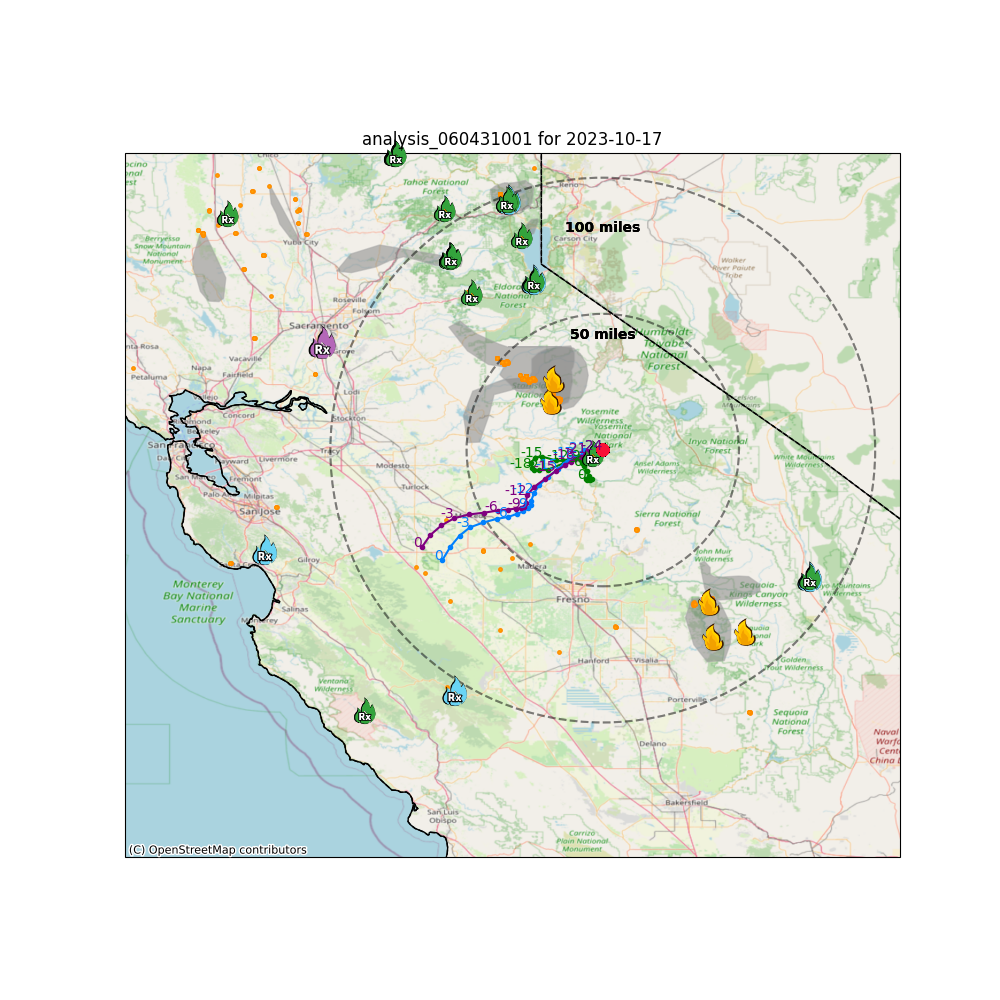
HYSPLIT 24-hour backward trajectories from Yosemite Village - Visitor Center (060431001) at 100, 150, and 200 meters above ground level, initiated at the highest hourly concentration on Oct. 17, 2023.
Sorry, the Bluesky smoke analysis image is not available for this fire.