Initial Exceedance Analysis for July 27, 2026
Monitors Exceeding PM2.5 Concentration of 35
| Monitor AQS ID | Site Name | Location (Lat, Long) | PM2.5 Value | AQI Category |
|---|---|---|---|---|
| 160010017 | White Pine | 43.58, -116.18 | 91.1 | Unhealthy |
| 160130004 | Ketchum | 43.68, -114.37 | 40.5 | Sensitive Group |
| 160830007 | Twin Falls PM25 | 42.57, -114.49 | 120.3 | Unhealthy |
| 410250003 | Burns - Washington St. | 43.59, -119.05 | 102.7 | Unhealthy |
| 840160270010 | Nampa Ridgecrest | 43.60, -116.53 | 116.6 | Unhealthy |
| 160150001 | Idaho City | 43.82, -115.84 | 60.7 | Unhealthy |
Air Quality Analysis
| Monitor AQS ID | Air Quality Analysis |
|---|---|
| 160010017 | Hourly PM2.5 Analysis At White Pine, hourly PM2.5 concentrations showed a decreasing trend on July 27 and July 28. PM2.5 levels exceeded 35 µg/m³ on 47 occasions, occurring at: July 27, 12:00 AM, July 27, 01:00 AM, July 27, 02:00 AM, July 27, 03:00 AM, July 27, 04:00 AM, July 27, 05:00 AM, July 27, 06:00 AM, July 27, 07:00 AM, July 27, 08:00 AM, July 27, 09:00 AM, July 27, 10:00 AM, July 27, 11:00 AM, July 27, 12:00 PM, July 27, 01:00 PM, July 27, 02:00 PM, July 27, 03:00 PM, July 27, 04:00 PM, July 27, 06:00 PM, July 27, 07:00 PM, July 27, 08:00 PM, July 27, 09:00 PM, July 27, 10:00 PM, July 27, 11:00 PM, July 28, 12:00 AM, July 28, 01:00 AM, July 28, 02:00 AM, July 28, 03:00 AM, July 28, 04:00 AM, July 28, 05:00 AM, July 28, 06:00 AM, July 28, 07:00 AM, July 28, 08:00 AM, July 28, 09:00 AM, July 28, 10:00 AM, July 28, 11:00 AM, July 28, 12:00 PM, July 28, 01:00 PM, July 28, 02:00 PM, July 28, 03:00 PM, July 28, 04:00 PM, July 28, 05:00 PM, July 28, 06:00 PM, July 28, 07:00 PM, July 28, 08:00 PM, July 28, 09:00 PM, July 28, 10:00 PM, July 28, 11:00 PM. Among these exceedances, 10 were significant pollution spikes (peaks), recorded at: July 27, 03:00 AM, July 27, 06:00 AM, July 27, 09:00 AM, July 27, 11:00 AM, July 27, 08:00 PM, July 27, 10:00 PM, July 28, 01:00 AM, July 28, 10:00 AM, July 28, 03:00 PM, July 28, 10:00 PM. Hourly PM2.5 levels showed a distinct day-night pattern. The highest recorded PM2.5 concentration was 225.0 µg/m³ at July 27, 09:00 AM, while the lowest was 32.0 µg/m³ at July 27, 05:00 PM. Unusual PM2.5 spikes detected at: July 27, 08:00 AM, July 27, 09:00 AM, July 27, 11:00 AM. Daily PM2.5 Analysis of the Year Throughout 2026, PM2.5 levels at White Pine exceeded 35 µg/m³ on 5 days, which accounts for 1.4% of the year. On July 27, 2026, the PM2.5 concentration reached 91.1 µg/m³, ranking #1 among exceedance events this year. This event matches the highest PM2.5 exceedance recorded this year. The majority of exceedance events occurred in July, with 5 occurrences. The season with the highest exceedance frequency was Summer, accounting for 5 exceedance days. Historical daily PM2.5 Analysis Between 2022 and 2026, PM2.5 levels at White Pine exceeded the 35 µg/m³ daily standard most frequently during Summer, accounting for 31.4% of all exceedances. The month with the highest number of exceedances was July, making up 14.9% of the total. The exceedance recorded on July 27, 2026 at White Pine reached 91.1 µg/m³, which is 81.9 µg/m³ higher than the average Summer PM2.5 level of 9.2 µg/m³. This exceedance ranks #1 out of 388 exceedances recorded from 2022 to 2026, placing it among the top 10 highest exceedances. These exceedances are often influenced by seasonal factors such as wildfires, prescribed burns, stagnant air, temperature inversions, or increased local emissions. |
| 160130004 | Hourly PM2.5 Analysis At Ketchum, hourly PM2.5 concentrations showed no significant trend on July 27 and July 28. PM2.5 levels exceeded 35 µg/m³ on 29 occasions, occurring at: July 27, 05:00 AM, July 27, 06:00 AM, July 27, 07:00 AM, July 27, 08:00 AM, July 27, 09:00 AM, July 27, 10:00 AM, July 27, 11:00 AM, July 27, 12:00 PM, July 27, 02:00 PM, July 27, 03:00 PM, July 27, 04:00 PM, July 27, 05:00 PM, July 27, 07:00 PM, July 27, 08:00 PM, July 27, 09:00 PM, July 27, 10:00 PM, July 27, 11:00 PM, July 28, 12:00 AM, July 28, 01:00 AM, July 28, 02:00 AM, July 28, 03:00 AM, July 28, 04:00 AM, July 28, 05:00 AM, July 28, 06:00 AM, July 28, 07:00 AM, July 28, 08:00 AM, July 28, 09:00 AM, July 28, 10:00 AM, July 28, 11:00 AM. Among these exceedances, 8 were significant pollution spikes (peaks), recorded at: July 27, 07:00 AM, July 27, 10:00 AM, July 27, 03:00 PM, July 27, 05:00 PM, July 27, 08:00 PM, July 28, 04:00 AM, July 28, 06:00 AM, July 28, 08:00 AM. No clear day-night pattern was observed in hourly PM2.5 levels. The highest recorded PM2.5 concentration was 64.7 µg/m³ at July 27, 08:00 PM, while the lowest was 13.2 µg/m³ at July 28, 08:00 PM. Unusual PM2.5 spikes detected at: July 27, 03:00 PM, July 27, 08:00 PM, July 27, 09:00 PM. Daily PM2.5 Analysis of the Year Throughout 2026, PM2.5 levels at Ketchum exceeded 35 µg/m³ on 1 days, which accounts for 0.3% of the year. On July 27, 2026, the PM2.5 concentration reached 40.5 µg/m³, ranking #1 among exceedance events this year. This event matches the highest PM2.5 exceedance recorded this year. The majority of exceedance events occurred in July, with 1 occurrences. The season with the highest exceedance frequency was Summer, accounting for 1 exceedance days. Historical daily PM2.5 Analysis Between 2022 and 2026, PM2.5 levels at Ketchum exceeded the 35 µg/m³ daily standard most frequently during Spring, accounting for 27.7% of all exceedances. The month with the highest number of exceedances was January, making up 9.4% of the total. The exceedance recorded on July 27, 2026 at Ketchum reached 40.5 µg/m³, which is 36.6 µg/m³ higher than the average Spring PM2.5 level of 3.9 µg/m³. This exceedance is notable but does not rank in the top 10 highest exceedances recorded from 2022 to 2026. These exceedances are often influenced by seasonal factors such as wildfires, prescribed burns, stagnant air, temperature inversions, or increased local emissions. |
| 160830007 | Hourly PM2.5 Analysis At Twin Falls PM25, hourly PM2.5 concentrations showed a decreasing trend on July 27 and July 28. PM2.5 levels exceeded 35 µg/m³ on 40 occasions, occurring at: July 27, 12:00 AM, July 27, 01:00 AM, July 27, 02:00 AM, July 27, 03:00 AM, July 27, 04:00 AM, July 27, 05:00 AM, July 27, 06:00 AM, July 27, 07:00 AM, July 27, 08:00 AM, July 27, 09:00 AM, July 27, 10:00 AM, July 27, 11:00 AM, July 27, 12:00 PM, July 27, 01:00 PM, July 27, 02:00 PM, July 27, 03:00 PM, July 27, 04:00 PM, July 27, 05:00 PM, July 27, 06:00 PM, July 27, 07:00 PM, July 27, 08:00 PM, July 27, 09:00 PM, July 27, 10:00 PM, July 27, 11:00 PM, July 28, 12:00 AM, July 28, 01:00 AM, July 28, 02:00 AM, July 28, 03:00 AM, July 28, 04:00 AM, July 28, 05:00 AM, July 28, 06:00 AM, July 28, 07:00 AM, July 28, 08:00 AM, July 28, 09:00 AM, July 28, 10:00 AM, July 28, 11:00 AM, July 28, 12:00 PM, July 28, 01:00 PM, July 28, 02:00 PM, July 28, 03:00 PM. Among these exceedances, 6 were significant pollution spikes (peaks), recorded at: July 27, 08:00 AM, July 27, 02:00 PM, July 27, 06:00 PM, July 27, 09:00 PM, July 28, 12:00 AM, July 28, 09:00 AM. Hourly PM2.5 levels showed a distinct day-night pattern. The highest recorded PM2.5 concentration was 231.0 µg/m³ at July 27, 08:00 AM, while the lowest was -7.0 µg/m³ at July 28, 07:00 PM. Unusual PM2.5 spikes detected at: July 27, 08:00 AM, July 27, 09:00 AM, July 27, 10:00 AM. Daily PM2.5 Analysis of the Year Throughout 2026, PM2.5 levels at Twin Falls PM25 exceeded 35 µg/m³ on 3 days, which accounts for 0.8% of the year. On July 27, 2026, the PM2.5 concentration reached 120.3 µg/m³, ranking #1 among exceedance events this year. This event matches the highest PM2.5 exceedance recorded this year. The majority of exceedance events occurred in July, with 3 occurrences. The season with the highest exceedance frequency was Summer, accounting for 3 exceedance days. Historical daily PM2.5 Analysis Between 2022 and 2026, PM2.5 levels at Twin Falls PM25 exceeded the 35 µg/m³ daily standard most frequently during Spring, accounting for 27.3% of all exceedances. The month with the highest number of exceedances was March, making up 9.4% of the total. The exceedance recorded on July 27, 2026 at Twin Falls PM25 reached 120.3 µg/m³, which is 116.2 µg/m³ higher than the average Spring PM2.5 level of 4.1 µg/m³. This exceedance ranks #1 out of 1598 exceedances recorded from 2022 to 2026, placing it among the top 10 highest exceedances. These exceedances are often influenced by seasonal factors such as wildfires, prescribed burns, stagnant air, temperature inversions, or increased local emissions. |
| 410250003 | Hourly PM2.5 Analysis At Burns - Washington St., hourly PM2.5 concentrations showed a decreasing trend on July 27 and July 28. PM2.5 levels exceeded 35 µg/m³ on 46 occasions, occurring at: July 27, 12:00 AM, July 27, 01:00 AM, July 27, 02:00 AM, July 27, 03:00 AM, July 27, 04:00 AM, July 27, 05:00 AM, July 27, 06:00 AM, July 27, 07:00 AM, July 27, 08:00 AM, July 27, 09:00 AM, July 27, 10:00 AM, July 27, 11:00 AM, July 27, 12:00 PM, July 27, 01:00 PM, July 27, 02:00 PM, July 27, 03:00 PM, July 27, 04:00 PM, July 27, 05:00 PM, July 27, 06:00 PM, July 27, 07:00 PM, July 27, 08:00 PM, July 27, 09:00 PM, July 27, 10:00 PM, July 27, 11:00 PM, July 28, 12:00 AM, July 28, 01:00 AM, July 28, 02:00 AM, July 28, 03:00 AM, July 28, 04:00 AM, July 28, 05:00 AM, July 28, 06:00 AM, July 28, 07:00 AM, July 28, 08:00 AM, July 28, 09:00 AM, July 28, 10:00 AM, July 28, 11:00 AM, July 28, 01:00 PM, July 28, 02:00 PM, July 28, 03:00 PM, July 28, 04:00 PM, July 28, 05:00 PM, July 28, 07:00 PM, July 28, 08:00 PM, July 28, 09:00 PM, July 28, 10:00 PM, July 28, 11:00 PM. Among these exceedances, 10 were significant pollution spikes (peaks), recorded at: July 27, 03:00 AM, July 27, 06:00 AM, July 27, 08:00 AM, July 27, 11:00 AM, July 27, 04:00 PM, July 27, 09:00 PM, July 28, 06:00 AM, July 28, 11:00 AM, July 28, 03:00 PM, July 28, 08:00 PM. Hourly PM2.5 levels showed a distinct day-night pattern. The highest recorded PM2.5 concentration was 241.3 µg/m³ at July 27, 06:00 AM, while the lowest was 32.6 µg/m³ at July 28, 06:00 PM. Unusual PM2.5 spikes detected at: July 27, 03:00 AM, July 27, 05:00 AM, July 27, 06:00 AM. Daily PM2.5 Analysis of the Year Throughout 2026, PM2.5 levels at Burns - Washington St. exceeded 35 µg/m³ on 8 days, which accounts for 2.2% of the year. On July 27, 2026, the PM2.5 concentration reached 102.7 µg/m³, ranking #2 among exceedance events this year. The highest PM2.5 exceedance this year was 145.5 µg/m³ on July 26, 2026, which was 42.8 µg/m³ higher than this event. The majority of exceedance events occurred in July, with 8 occurrences. The season with the highest exceedance frequency was Summer, accounting for 8 exceedance days. Historical daily PM2.5 Analysis Between 2022 and 2026, PM2.5 levels at Burns - Washington St. exceeded the 35 µg/m³ daily standard most frequently during Spring, accounting for 27.9% of all exceedances. The month with the highest number of exceedances was May, making up 9.4% of the total. The exceedance recorded on July 27, 2026 at Burns - Washington St. reached 102.7 µg/m³, which is 98.0 µg/m³ higher than the average Spring PM2.5 level of 4.7 µg/m³. This exceedance ranks #7 out of 1646 exceedances recorded from 2022 to 2026, placing it among the top 10 highest exceedances. These exceedances are often influenced by seasonal factors such as wildfires, prescribed burns, stagnant air, temperature inversions, or increased local emissions. |
| 840160270010 | Hourly PM2.5 Analysis At Nampa Ridgecrest, hourly PM2.5 concentrations showed no significant trend on July 27 and July 28. PM2.5 levels exceeded 35 µg/m³ on 48 occasions, occurring at: July 27, 12:00 AM, July 27, 01:00 AM, July 27, 02:00 AM, July 27, 03:00 AM, July 27, 04:00 AM, July 27, 05:00 AM, July 27, 06:00 AM, July 27, 07:00 AM, July 27, 08:00 AM, July 27, 09:00 AM, July 27, 10:00 AM, July 27, 11:00 AM, July 27, 12:00 PM, July 27, 01:00 PM, July 27, 02:00 PM, July 27, 03:00 PM, July 27, 04:00 PM, July 27, 05:00 PM, July 27, 06:00 PM, July 27, 07:00 PM, July 27, 08:00 PM, July 27, 09:00 PM, July 27, 10:00 PM, July 27, 11:00 PM, July 28, 12:00 AM, July 28, 01:00 AM, July 28, 02:00 AM, July 28, 03:00 AM, July 28, 04:00 AM, July 28, 05:00 AM, July 28, 06:00 AM, July 28, 07:00 AM, July 28, 08:00 AM, July 28, 09:00 AM, July 28, 10:00 AM, July 28, 11:00 AM, July 28, 12:00 PM, July 28, 01:00 PM, July 28, 02:00 PM, July 28, 03:00 PM, July 28, 04:00 PM, July 28, 05:00 PM, July 28, 06:00 PM, July 28, 07:00 PM, July 28, 08:00 PM, July 28, 09:00 PM, July 28, 10:00 PM, July 28, 11:00 PM. Among these exceedances, 10 were significant pollution spikes (peaks), recorded at: July 27, 03:00 AM, July 27, 07:00 AM, July 27, 12:00 PM, July 27, 03:00 PM, July 27, 11:00 PM, July 28, 03:00 AM, July 28, 06:00 AM, July 28, 10:00 AM, July 28, 04:00 PM, July 28, 08:00 PM. Hourly PM2.5 levels showed a distinct day-night pattern. The highest recorded PM2.5 concentration was 214.0 µg/m³ at July 27, 03:00 AM, while the lowest was 38.0 µg/m³ at July 27, 08:00 PM. Unusual PM2.5 spikes detected at: July 27, 02:00 AM, July 27, 03:00 AM, July 27, 04:00 AM. Daily PM2.5 Analysis of the Year Throughout 2026, PM2.5 levels at Nampa Ridgecrest exceeded 35 µg/m³ on 7 days, which accounts for 1.9% of the year. On July 27, 2026, the PM2.5 concentration reached 116.6 µg/m³, ranking #2 among exceedance events this year. The highest PM2.5 exceedance this year was 118.5 µg/m³ on July 26, 2026, which was 1.9 µg/m³ higher than this event. The majority of exceedance events occurred in July, with 7 occurrences. The season with the highest exceedance frequency was Summer, accounting for 7 exceedance days. Historical daily PM2.5 Analysis Between 2022 and 2026, PM2.5 levels at Nampa Ridgecrest exceeded the 35 µg/m³ daily standard most frequently during Summer, accounting for 28.4% of all exceedances. The month with the highest number of exceedances was July, making up 10.5% of the total. The exceedance recorded on July 27, 2026 at Nampa Ridgecrest reached 116.6 µg/m³, which is 105.7 µg/m³ higher than the average Summer PM2.5 level of 10.9 µg/m³. This exceedance ranks #2 out of 1140 exceedances recorded from 2022 to 2026, placing it among the top 10 highest exceedances. These exceedances are often influenced by seasonal factors such as wildfires, prescribed burns, stagnant air, temperature inversions, or increased local emissions. |
| 160150001 | Hourly PM2.5 Analysis At Idaho City, hourly PM2.5 concentrations showed no significant trend on July 27 and July 28. PM2.5 levels exceeded 35 µg/m³ on 44 occasions, occurring at: July 27, 12:00 AM, July 27, 01:00 AM, July 27, 02:00 AM, July 27, 03:00 AM, July 27, 04:00 AM, July 27, 05:00 AM, July 27, 06:00 AM, July 27, 07:00 AM, July 27, 08:00 AM, July 27, 09:00 AM, July 27, 10:00 AM, July 27, 11:00 AM, July 27, 12:00 PM, July 27, 01:00 PM, July 27, 02:00 PM, July 27, 03:00 PM, July 27, 04:00 PM, July 27, 05:00 PM, July 27, 06:00 PM, July 27, 07:00 PM, July 27, 08:00 PM, July 27, 09:00 PM, July 27, 10:00 PM, July 27, 11:00 PM, July 28, 12:00 AM, July 28, 01:00 AM, July 28, 02:00 AM, July 28, 03:00 AM, July 28, 04:00 AM, July 28, 05:00 AM, July 28, 06:00 AM, July 28, 07:00 AM, July 28, 08:00 AM, July 28, 09:00 AM, July 28, 10:00 AM, July 28, 11:00 AM, July 28, 12:00 PM, July 28, 01:00 PM, July 28, 02:00 PM, July 28, 03:00 PM, July 28, 04:00 PM, July 28, 09:00 PM, July 28, 10:00 PM, July 28, 11:00 PM. Among these exceedances, 11 were significant pollution spikes (peaks), recorded at: July 27, 04:00 AM, July 27, 07:00 AM, July 27, 11:00 AM, July 27, 03:00 PM, July 27, 06:00 PM, July 27, 09:00 PM, July 28, 04:00 AM, July 28, 06:00 AM, July 28, 08:00 AM, July 28, 12:00 PM, July 28, 03:00 PM. No clear day-night pattern was observed in hourly PM2.5 levels. The highest recorded PM2.5 concentration was 84.0 µg/m³ at July 27, 11:00 AM, while the lowest was 27.0 µg/m³ at July 28, 06:00 PM. Unusual PM2.5 spikes detected at: July 27, 07:00 AM, July 27, 08:00 AM, July 27, 11:00 AM. Daily PM2.5 Analysis of the Year Throughout 2026, PM2.5 levels at Idaho City exceeded 35 µg/m³ on 3 days, which accounts for 0.8% of the year. On July 27, 2026, the PM2.5 concentration reached 60.7 µg/m³, ranking #1 among exceedance events this year. This event matches the highest PM2.5 exceedance recorded this year. The majority of exceedance events occurred in July, with 3 occurrences. The season with the highest exceedance frequency was Summer, accounting for 3 exceedance days. Historical daily PM2.5 Analysis Between 2022 and 2026, PM2.5 levels at Idaho City exceeded the 35 µg/m³ daily standard most frequently during Spring, accounting for 27.3% of all exceedances. The month with the highest number of exceedances was July, making up 9.4% of the total. The exceedance recorded on July 27, 2026 at Idaho City reached 60.7 µg/m³, which is 55.1 µg/m³ higher than the average Spring PM2.5 level of 5.6 µg/m³. This exceedance ranks #9 out of 1606 exceedances recorded from 2022 to 2026, placing it among the top 10 highest exceedances. These exceedances are often influenced by seasonal factors such as wildfires, prescribed burns, stagnant air, temperature inversions, or increased local emissions. |
Average Hourly PM2.5 for Days Around Event
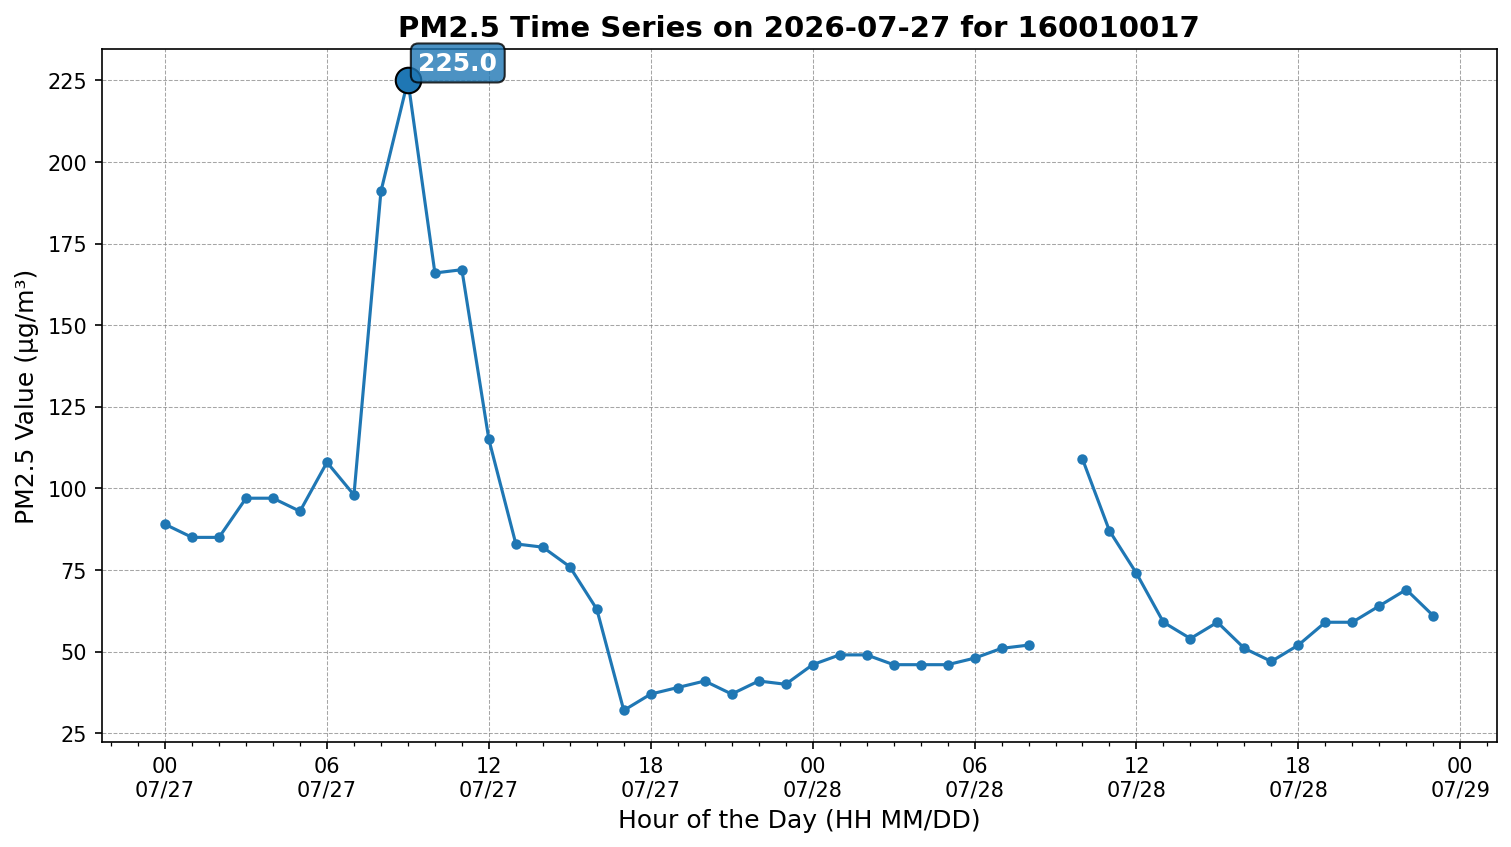
Time series of 1-hour PM2.5 concentrations at White Pine starting on July 27, 2026. The number "1" indicates the highest 1-hour PM2.5 concentration of the day, which is also the time used for HYSPLIT backward trajectory analysis.
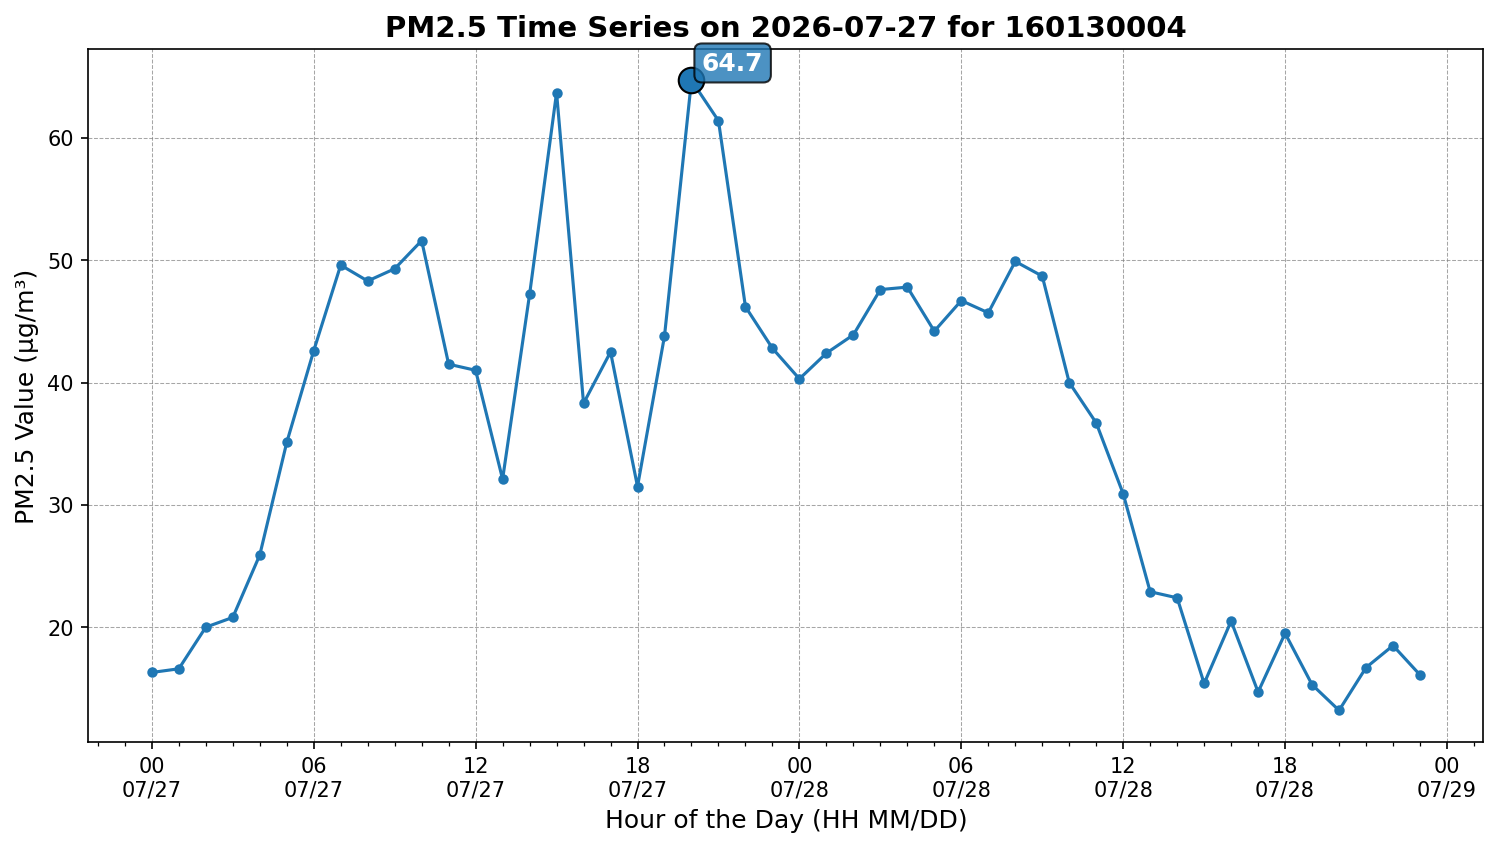
Time series of 1-hour PM2.5 concentrations at Ketchum starting on July 27, 2026. The number "1" indicates the highest 1-hour PM2.5 concentration of the day, which is also the time used for HYSPLIT backward trajectory analysis.
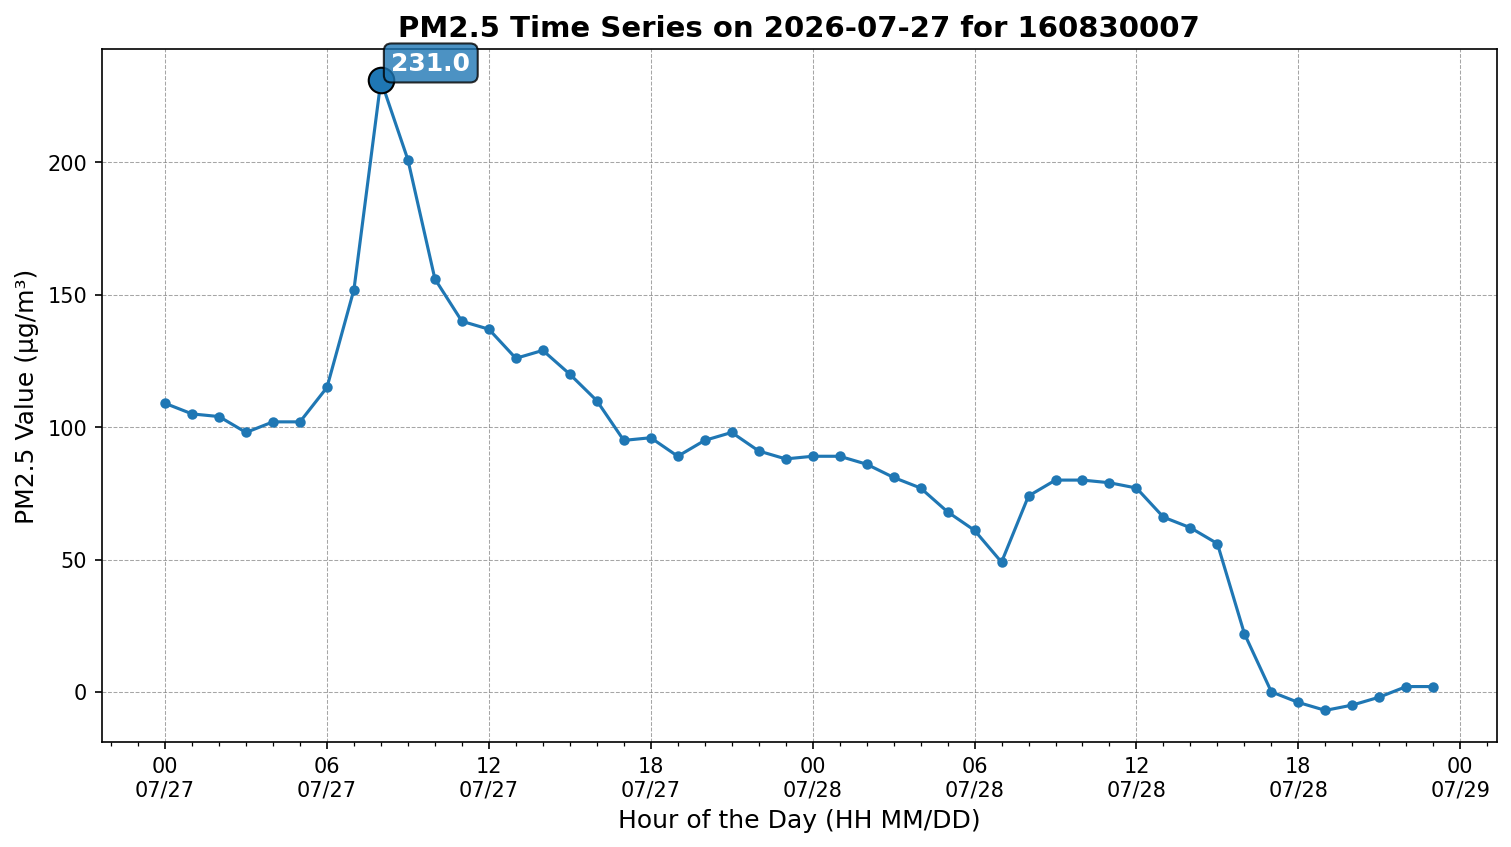
Time series of 1-hour PM2.5 concentrations at Twin Falls PM25 starting on July 27, 2026. The number "1" indicates the highest 1-hour PM2.5 concentration of the day, which is also the time used for HYSPLIT backward trajectory analysis.
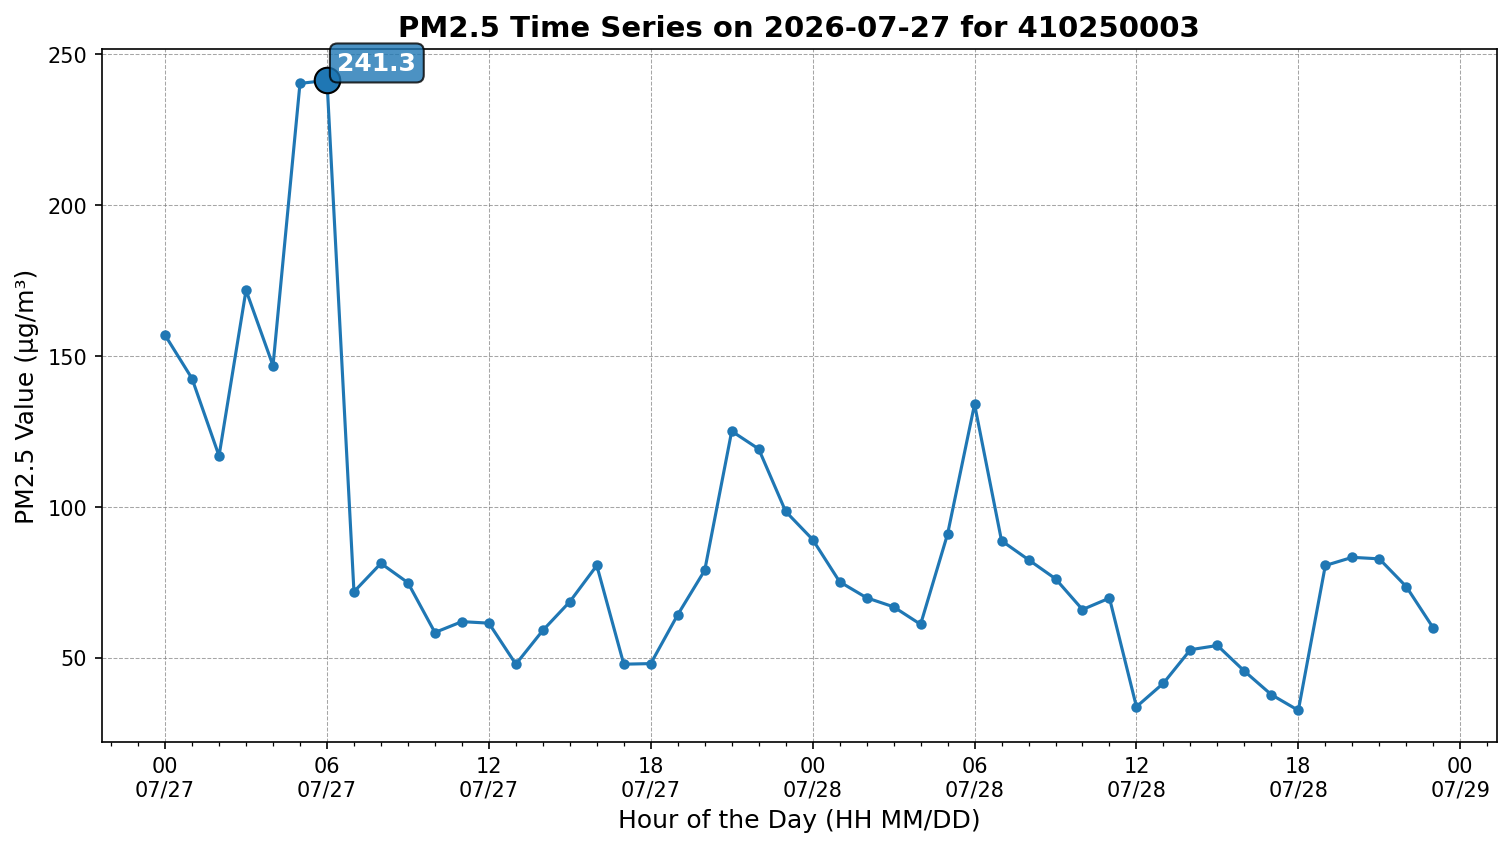
Time series of 1-hour PM2.5 concentrations at Burns - Washington St. starting on July 27, 2026. The number "1" indicates the highest 1-hour PM2.5 concentration of the day, which is also the time used for HYSPLIT backward trajectory analysis.
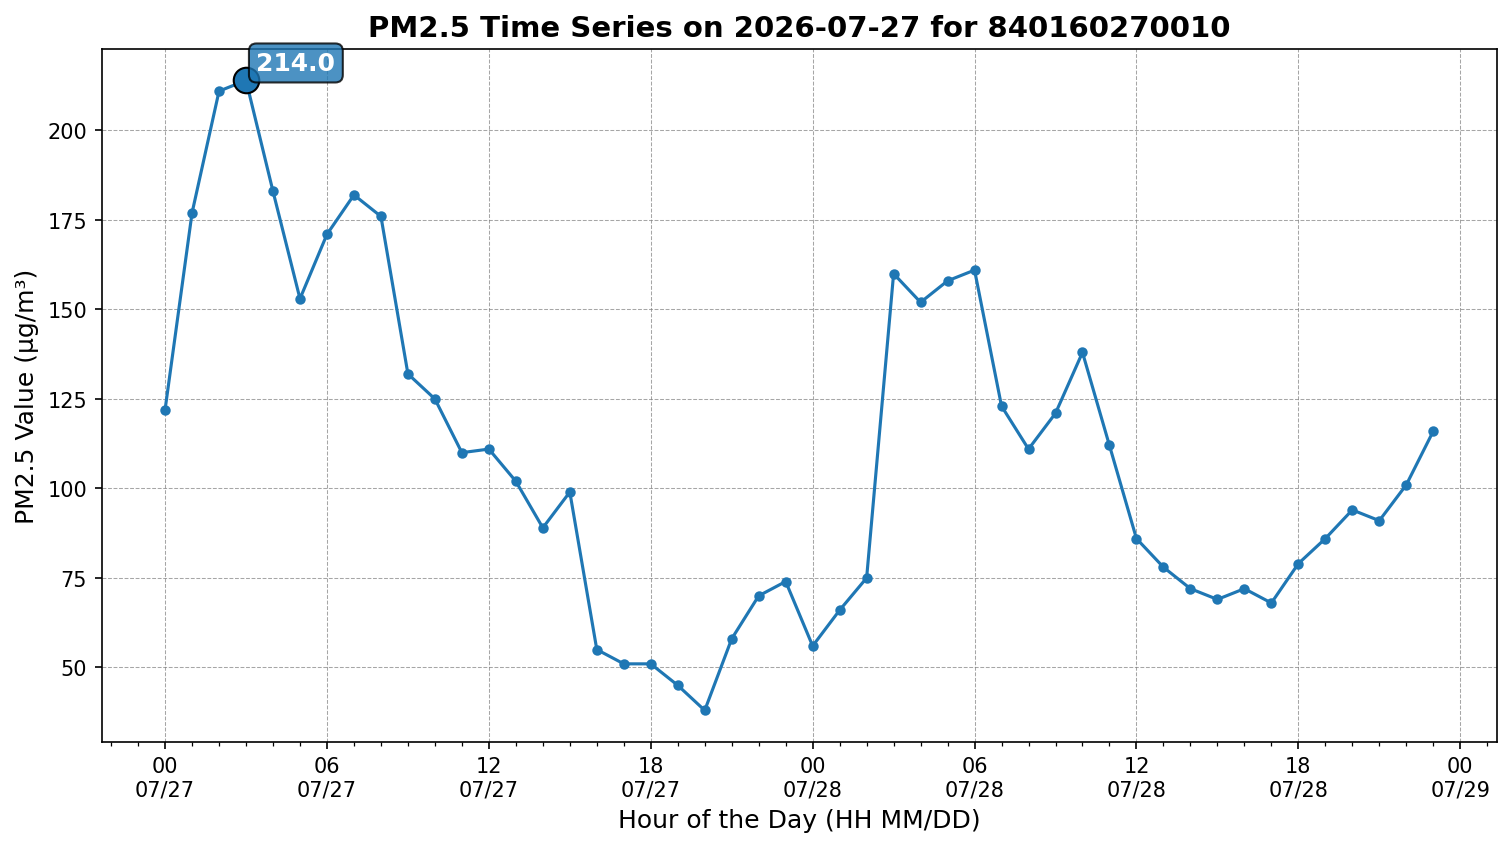
Time series of 1-hour PM2.5 concentrations at Nampa Ridgecrest starting on July 27, 2026. The number "1" indicates the highest 1-hour PM2.5 concentration of the day, which is also the time used for HYSPLIT backward trajectory analysis.
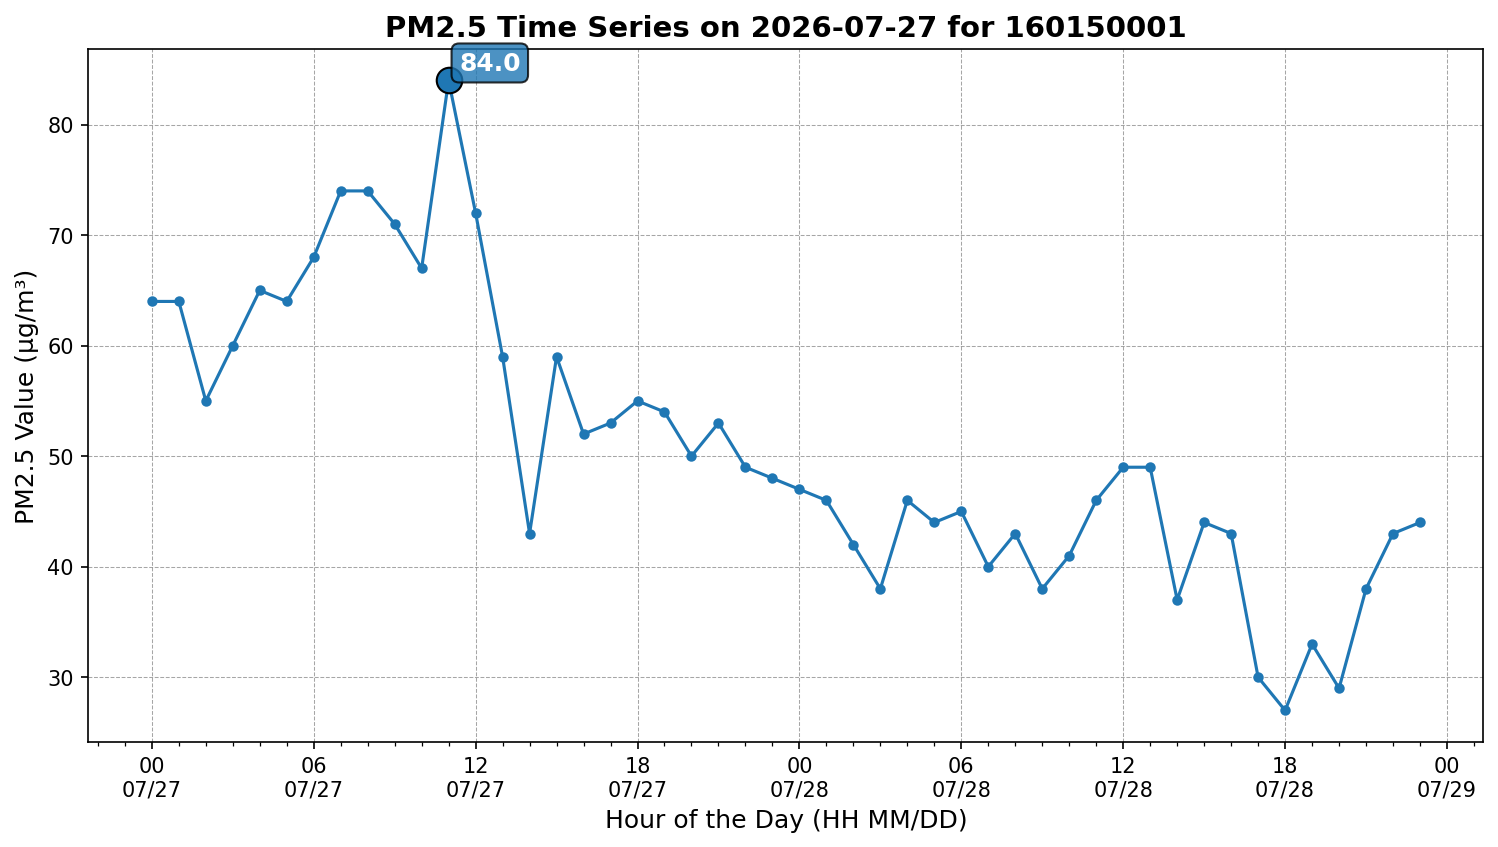
Time series of 1-hour PM2.5 concentrations at Idaho City starting on July 27, 2026. The number "1" indicates the highest 1-hour PM2.5 concentration of the day, which is also the time used for HYSPLIT backward trajectory analysis.
Historical 24-hr PM2.5 Concentration
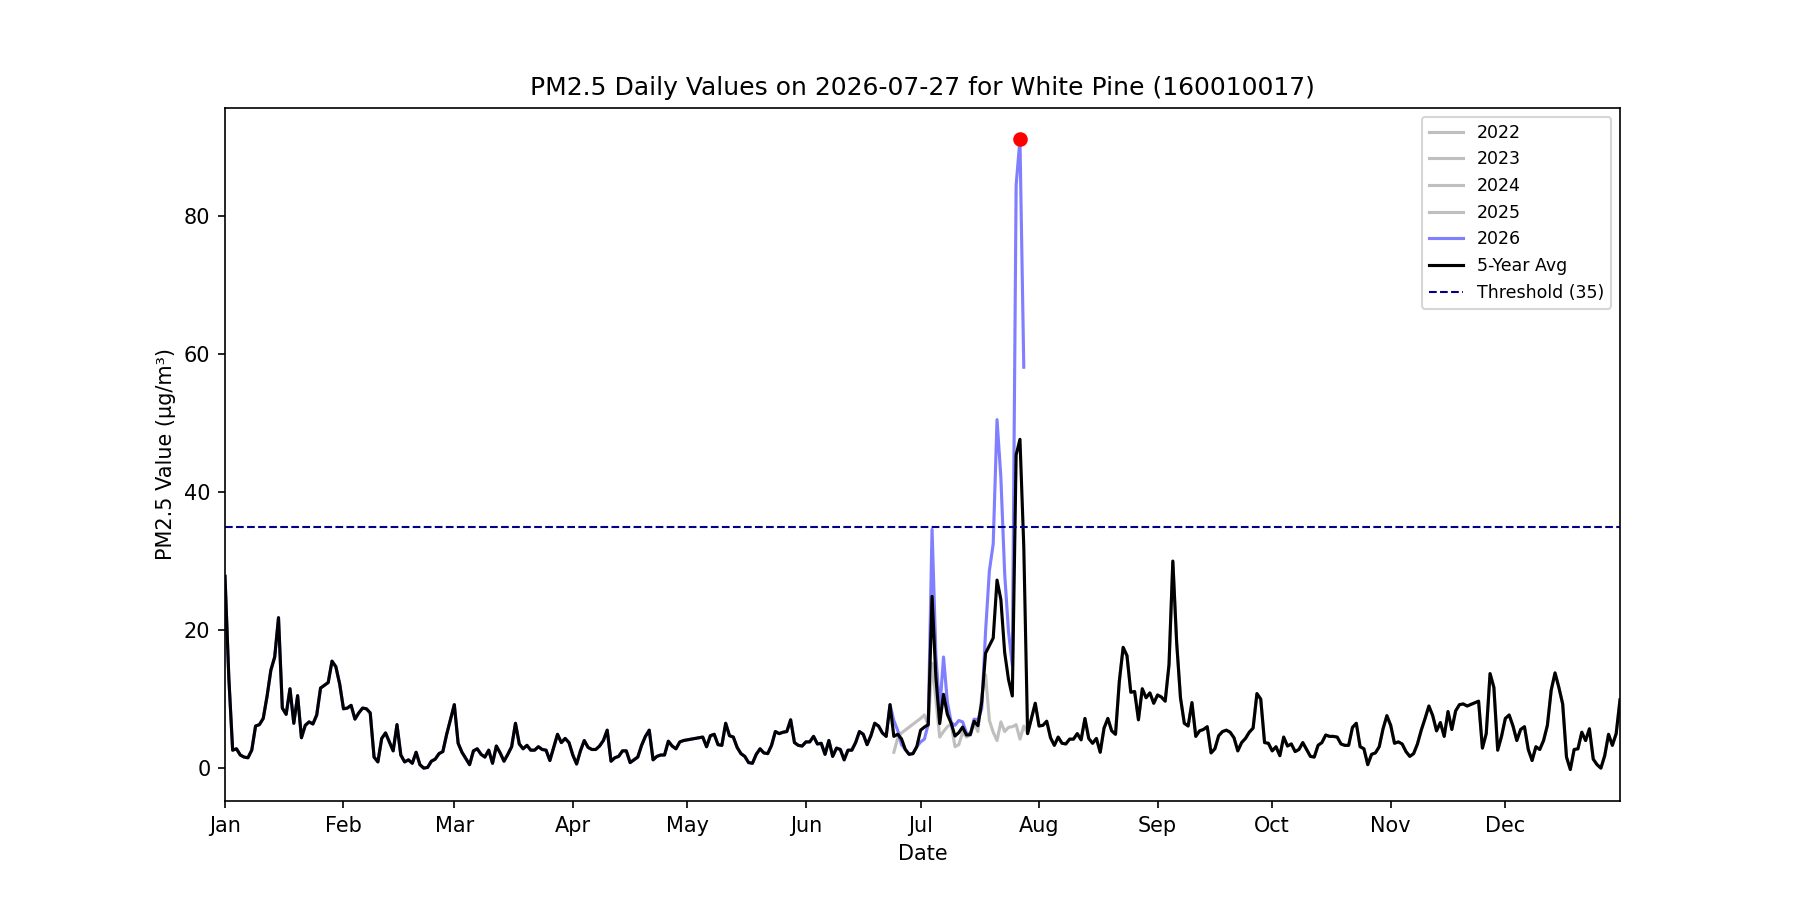
Time series plot of 24-hour PM2.5 concentrations at White Pine for each year between 2022 and 2026. The colored dots represent the 24-hour PM2.5 concentrations on July 27, 2026. The black line indicates the 5-year average 24-hour PM2.5 concentration, and the grey dashed line represents the 35 µg/m³ 24-hour PM2.5 standard.
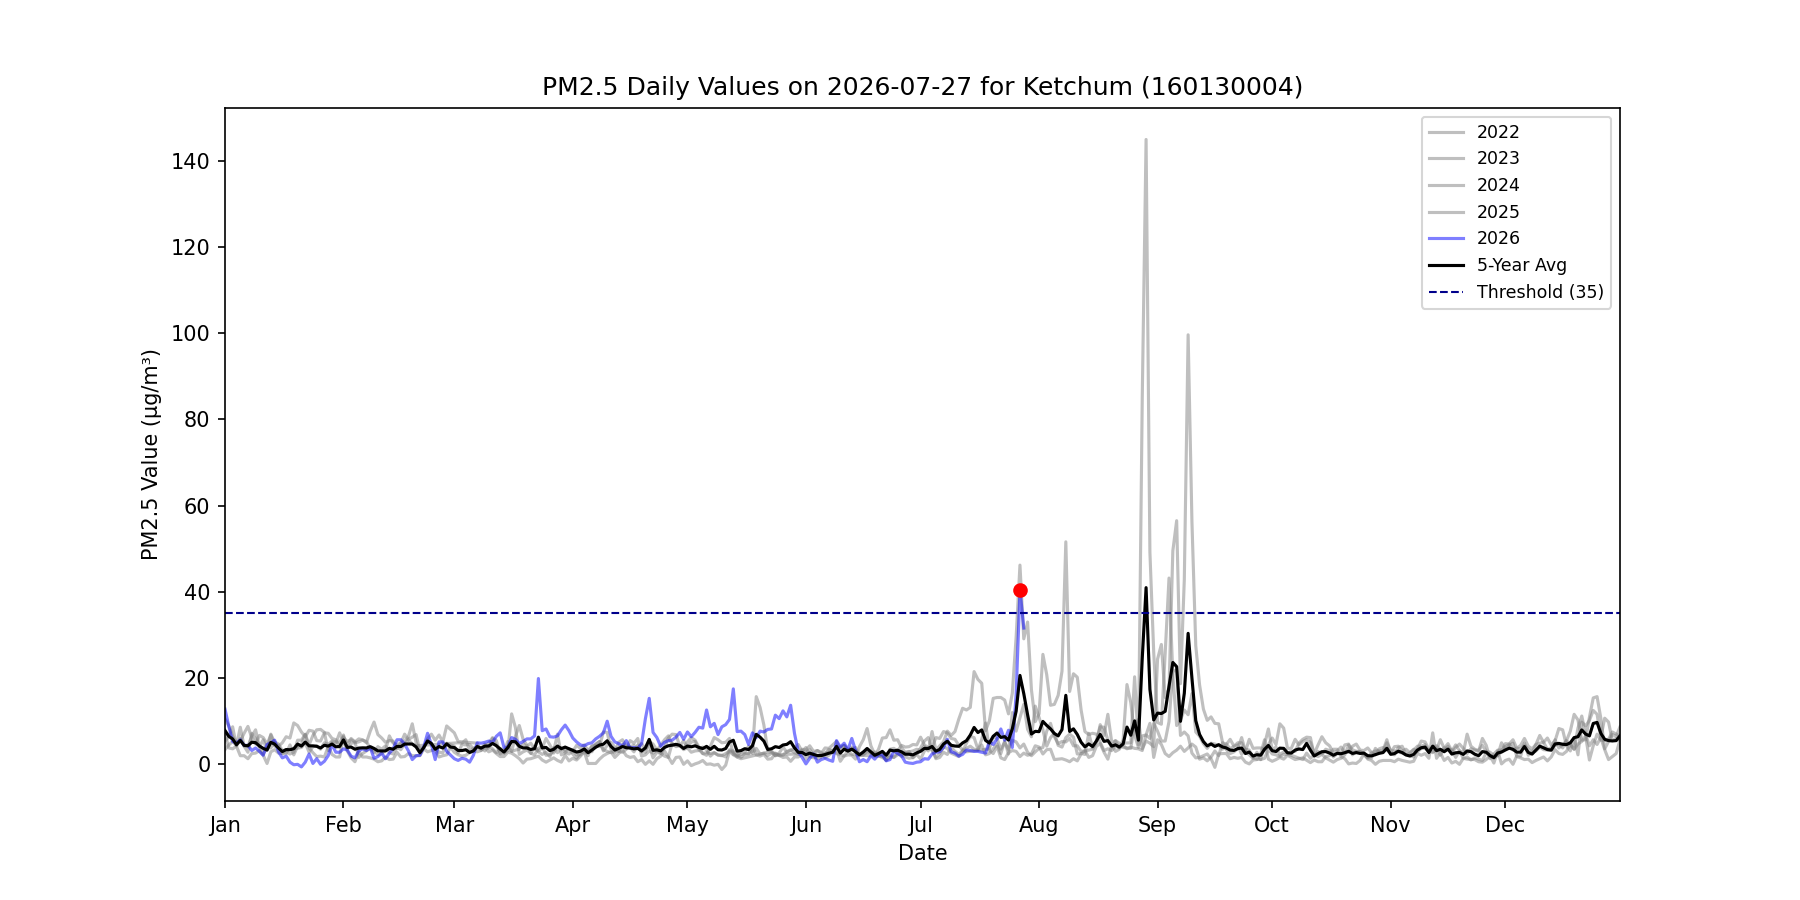
Time series plot of 24-hour PM2.5 concentrations at Ketchum for each year between 2022 and 2026. The colored dots represent the 24-hour PM2.5 concentrations on July 27, 2026. The black line indicates the 5-year average 24-hour PM2.5 concentration, and the grey dashed line represents the 35 µg/m³ 24-hour PM2.5 standard.
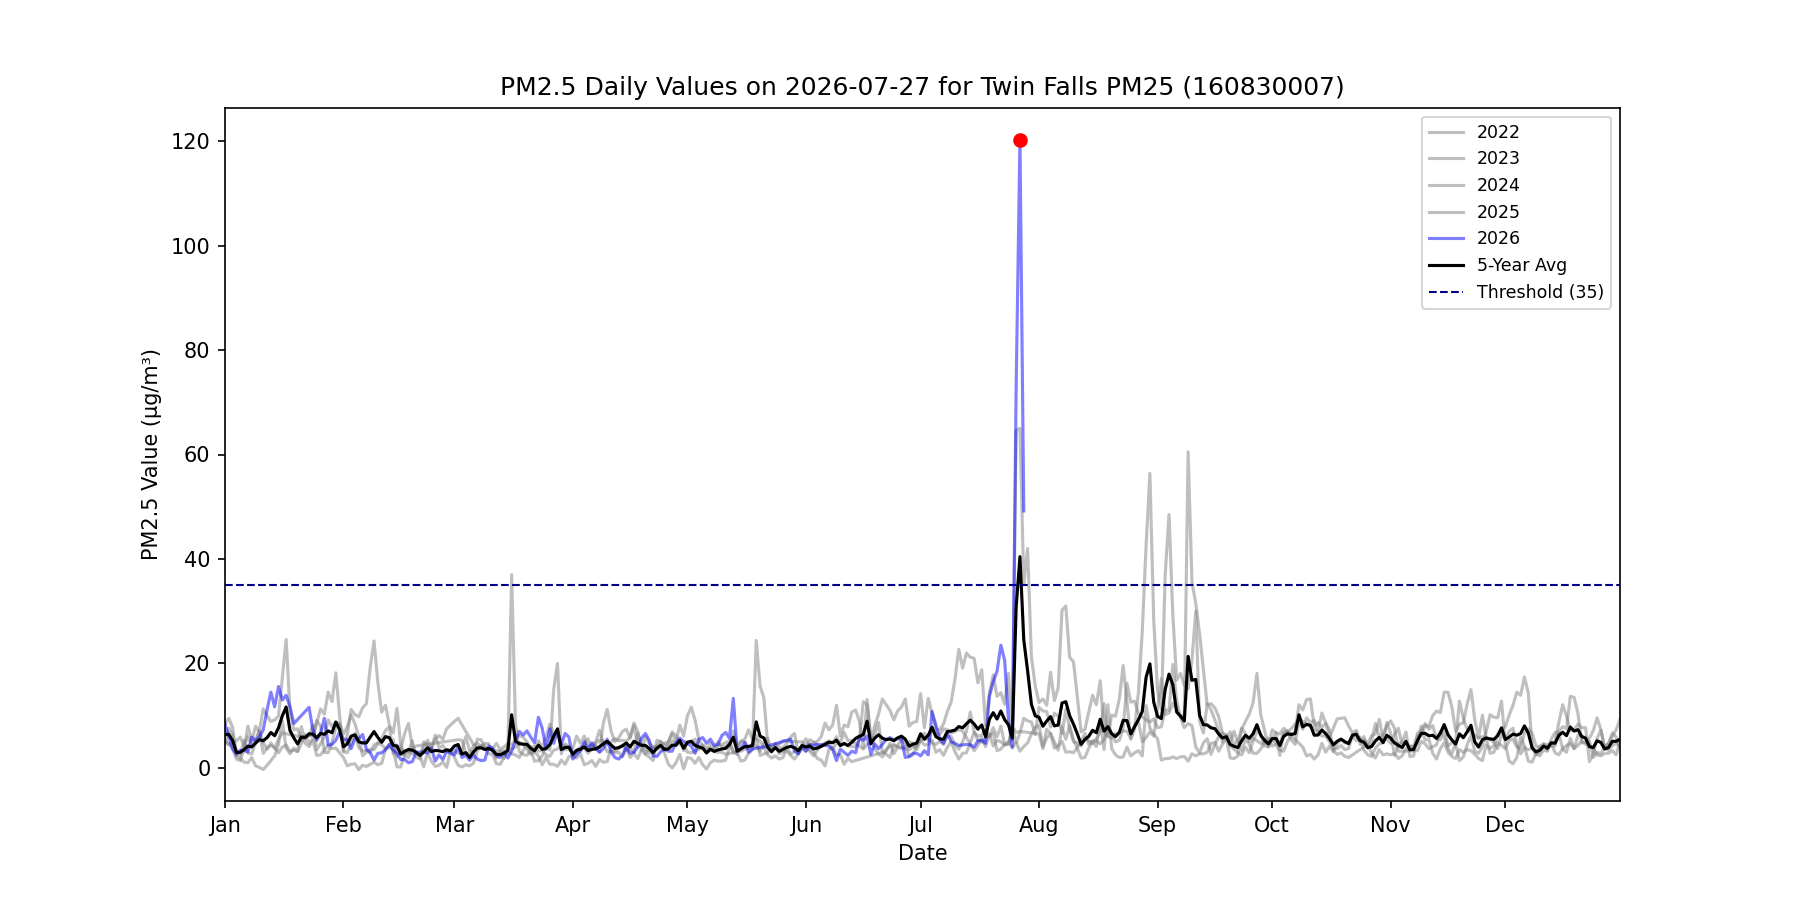
Time series plot of 24-hour PM2.5 concentrations at Twin Falls PM25 for each year between 2022 and 2026. The colored dots represent the 24-hour PM2.5 concentrations on July 27, 2026. The black line indicates the 5-year average 24-hour PM2.5 concentration, and the grey dashed line represents the 35 µg/m³ 24-hour PM2.5 standard.
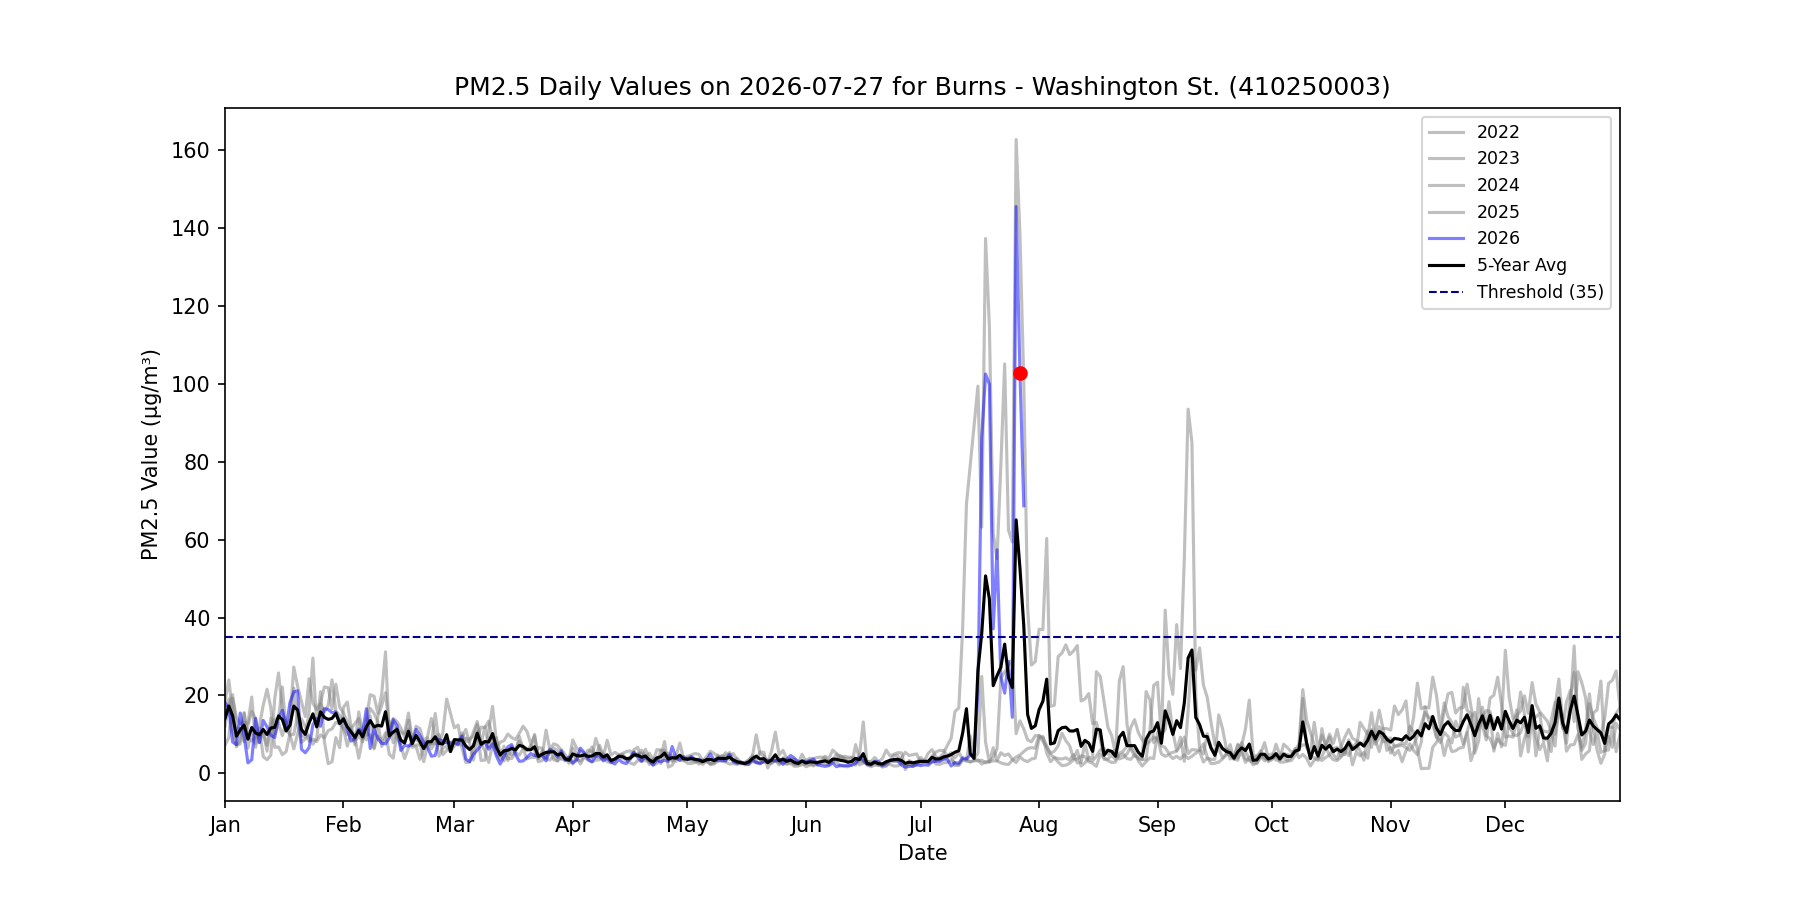
Time series plot of 24-hour PM2.5 concentrations at Burns - Washington St. for each year between 2022 and 2026. The colored dots represent the 24-hour PM2.5 concentrations on July 27, 2026. The black line indicates the 5-year average 24-hour PM2.5 concentration, and the grey dashed line represents the 35 µg/m³ 24-hour PM2.5 standard.
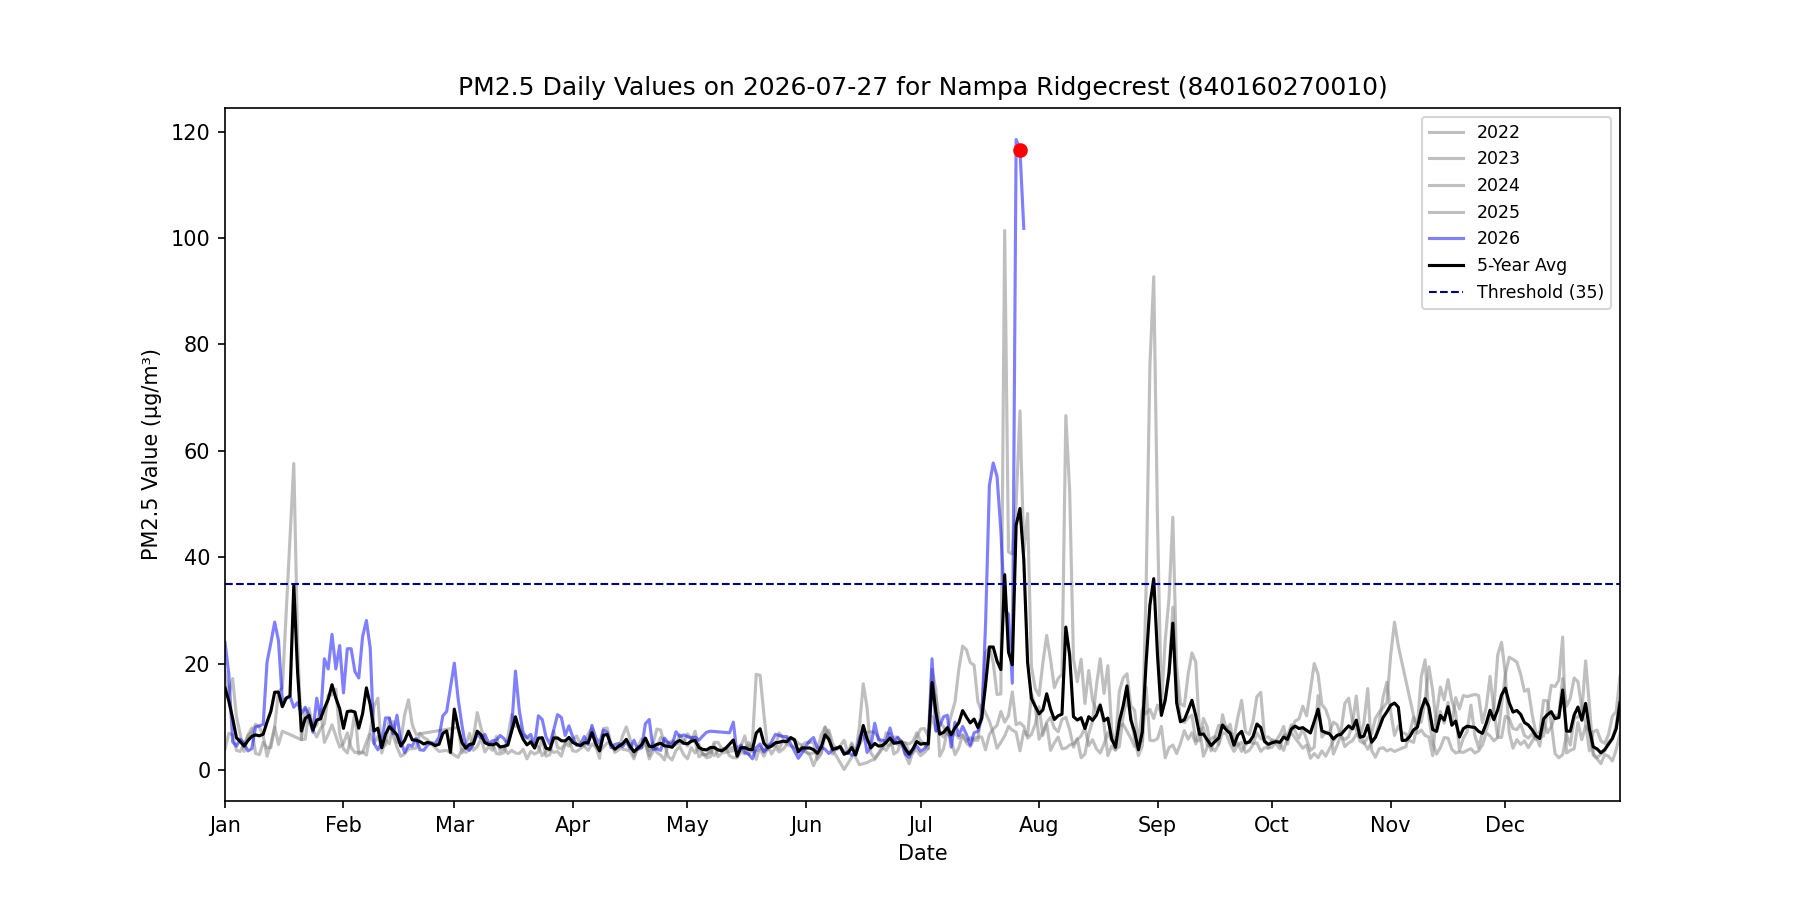
Time series plot of 24-hour PM2.5 concentrations at Nampa Ridgecrest for each year between 2022 and 2026. The colored dots represent the 24-hour PM2.5 concentrations on July 27, 2026. The black line indicates the 5-year average 24-hour PM2.5 concentration, and the grey dashed line represents the 35 µg/m³ 24-hour PM2.5 standard.
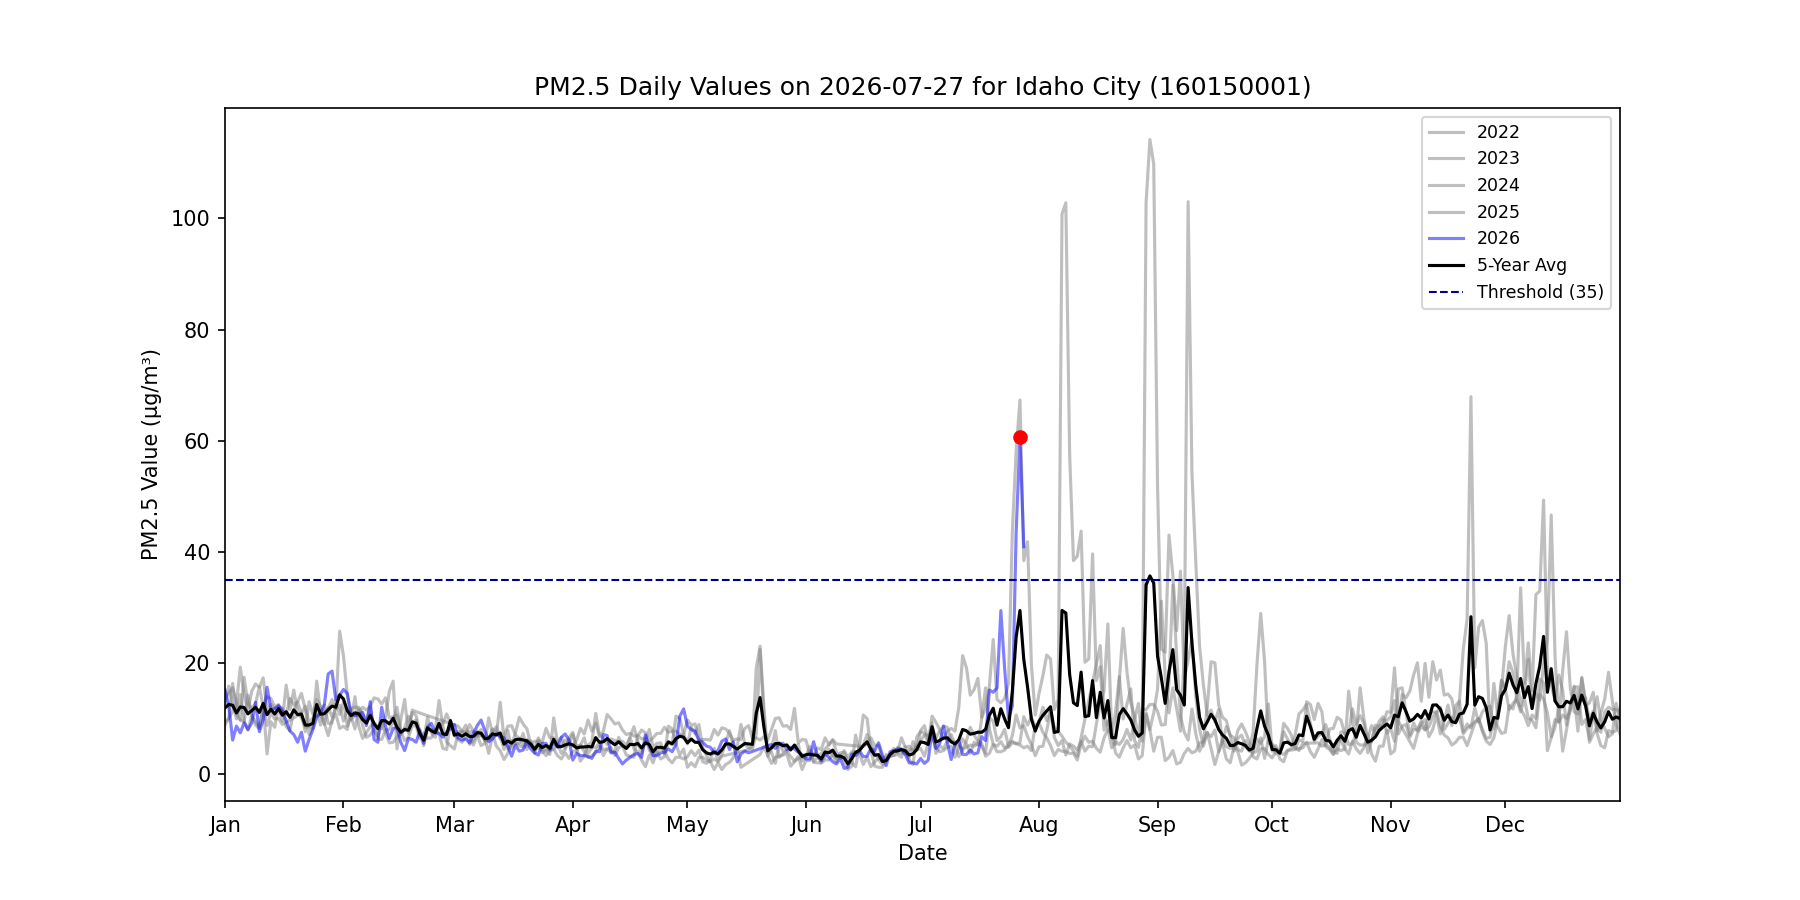
Time series plot of 24-hour PM2.5 concentrations at Idaho City for each year between 2022 and 2026. The colored dots represent the 24-hour PM2.5 concentrations on July 27, 2026. The black line indicates the 5-year average 24-hour PM2.5 concentration, and the grey dashed line represents the 35 µg/m³ 24-hour PM2.5 standard.
Prescribed Fires within 50 Miles
| Monitor AQS ID | On the Day | One Day Before | Two Days Before |
|---|---|---|---|
| 160010017 |
|
|
|
| 160130004 |
|
|
|
| 160830007 |
|
|
|
| 410250003 |
|
|
|
| 840160270010 |
|
|
|
| 160150001 |
|
|
|
Wildfires within 100 Miles
| Monitor AQS ID | 2-Day Range to Exceedance Date |
|---|---|
| 160010017 |
|
| 160130004 |
|
| 160830007 |
|
| 410250003 |
|
| 840160270010 |
|
| 160150001 |
|
Fire Emission Analysis
| Monitor AQS ID | Emission Analysis |
|---|---|
| 160010017 | No wildfires were identified within 100 miles of White Pine. No prescribed fires were identified within 50 miles of White Pine. While no prescribed fires or wildfires were recorded from CAL FIRE and the Prescribed Fire Reporting System (PFIRS), |
| 160130004 | No wildfires were identified within 100 miles of Ketchum. No prescribed fires were identified within 50 miles of Ketchum. While no prescribed fires or wildfires were recorded from CAL FIRE and the Prescribed Fire Reporting System (PFIRS), |
| 160830007 | No wildfires were identified within 100 miles of Twin Falls PM25. No prescribed fires were identified within 50 miles of Twin Falls PM25. While no prescribed fires or wildfires were recorded from CAL FIRE and the Prescribed Fire Reporting System (PFIRS), |
| 410250003 | No wildfires were identified within 100 miles of Burns - Washington St.. No prescribed fires were identified within 50 miles of Burns - Washington St.. While no prescribed fires or wildfires were recorded from CAL FIRE and the Prescribed Fire Reporting System (PFIRS), |
| 840160270010 | No wildfires were identified within 100 miles of Nampa Ridgecrest. No prescribed fires were identified within 50 miles of Nampa Ridgecrest. While no prescribed fires or wildfires were recorded from CAL FIRE and the Prescribed Fire Reporting System (PFIRS), |
| 160150001 | No wildfires were identified within 100 miles of Idaho City. No prescribed fires were identified within 50 miles of Idaho City. While no prescribed fires or wildfires were recorded from CAL FIRE and the Prescribed Fire Reporting System (PFIRS), |
HYSPLIT Trajectory for Exceedance Monitor Site
Sorry, the Bluesky smoke analysis image is not available for this fire.