Initial Exceedance Analysis for May 6, 2026
Monitors Exceeding PM2.5 Concentration of 35
| Monitor AQS ID | Site Name | Location (Lat, Long) | PM2.5 Value | AQI Category |
|---|---|---|---|---|
| 840410352040 | Chiloquin | 42.54, -121.92 | 45.1 | Sensitive Group |
Air Quality Analysis
| Monitor AQS ID | Air Quality Analysis |
|---|---|
| 840410352040 | Hourly PM2.5 Analysis At Chiloquin, hourly PM2.5 concentrations showed a decreasing trend on May 06 and May 07. PM2.5 levels exceeded 35 µg/m³ on 10 occasions, occurring at: May 06, 12:00 AM, May 06, 01:00 AM, May 06, 02:00 AM, May 06, 03:00 AM, May 06, 04:00 AM, May 06, 05:00 AM, May 06, 06:00 AM, May 06, 07:00 AM, May 06, 08:00 AM, May 07, 03:00 AM. Among these exceedances, 3 were significant pollution spikes (peaks), recorded at: May 06, 03:00 AM, May 06, 06:00 AM, May 07, 03:00 AM. Hourly PM2.5 levels showed a distinct day-night pattern. The highest recorded PM2.5 concentration was 249.2 µg/m³ at May 06, 12:00 AM, while the lowest was 1.8 µg/m³ at May 06, 02:00 PM. Unusual PM2.5 spikes detected at: May 06, 12:00 AM, May 06, 01:00 AM, May 06, 03:00 AM. Daily PM2.5 Analysis of the Year Throughout 2026, PM2.5 levels at Chiloquin exceeded 35 µg/m³ on 1 days, which accounts for 0.3% of the year. On May 06, 2026, the PM2.5 concentration reached 45.1 µg/m³, ranking #1 among exceedance events this year. This event matches the highest PM2.5 exceedance recorded this year. The majority of exceedance events occurred in May, with 1 occurrences. The season with the highest exceedance frequency was Spring, accounting for 1 exceedance days. Historical daily PM2.5 Analysis Between 2022 and 2026, PM2.5 levels at Chiloquin exceeded the 35 µg/m³ daily standard most frequently during Spring, accounting for 27.8% of all exceedances. The month with the highest number of exceedances was January, making up 10.1% of the total. The exceedance recorded on May 06, 2026 at Chiloquin reached 45.1 µg/m³, which is 42.3 µg/m³ higher than the average Spring PM2.5 level of 2.8 µg/m³. This exceedance is notable but does not rank in the top 10 highest exceedances recorded from 2022 to 2026. These exceedances are often influenced by seasonal factors such as wildfires, prescribed burns, stagnant air, temperature inversions, or increased local emissions. |
Average Hourly PM2.5 for Days Around Event
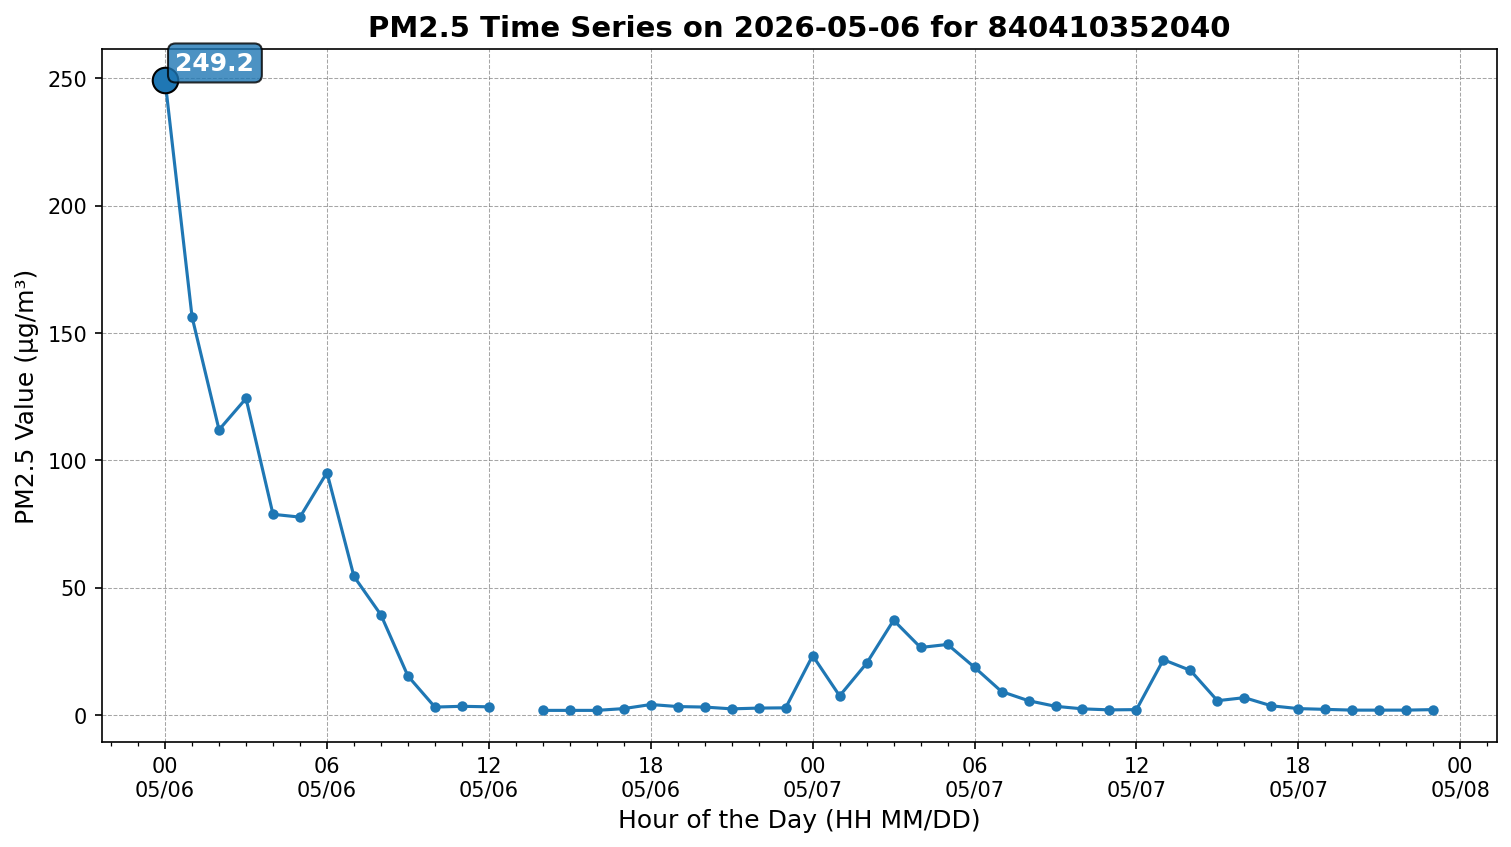
Time series of 1-hour PM2.5 concentrations at Chiloquin starting on May 6, 2026. The number "1" indicates the highest 1-hour PM2.5 concentration of the day, which is also the time used for HYSPLIT backward trajectory analysis.
Historical 24-hr PM2.5 Concentration
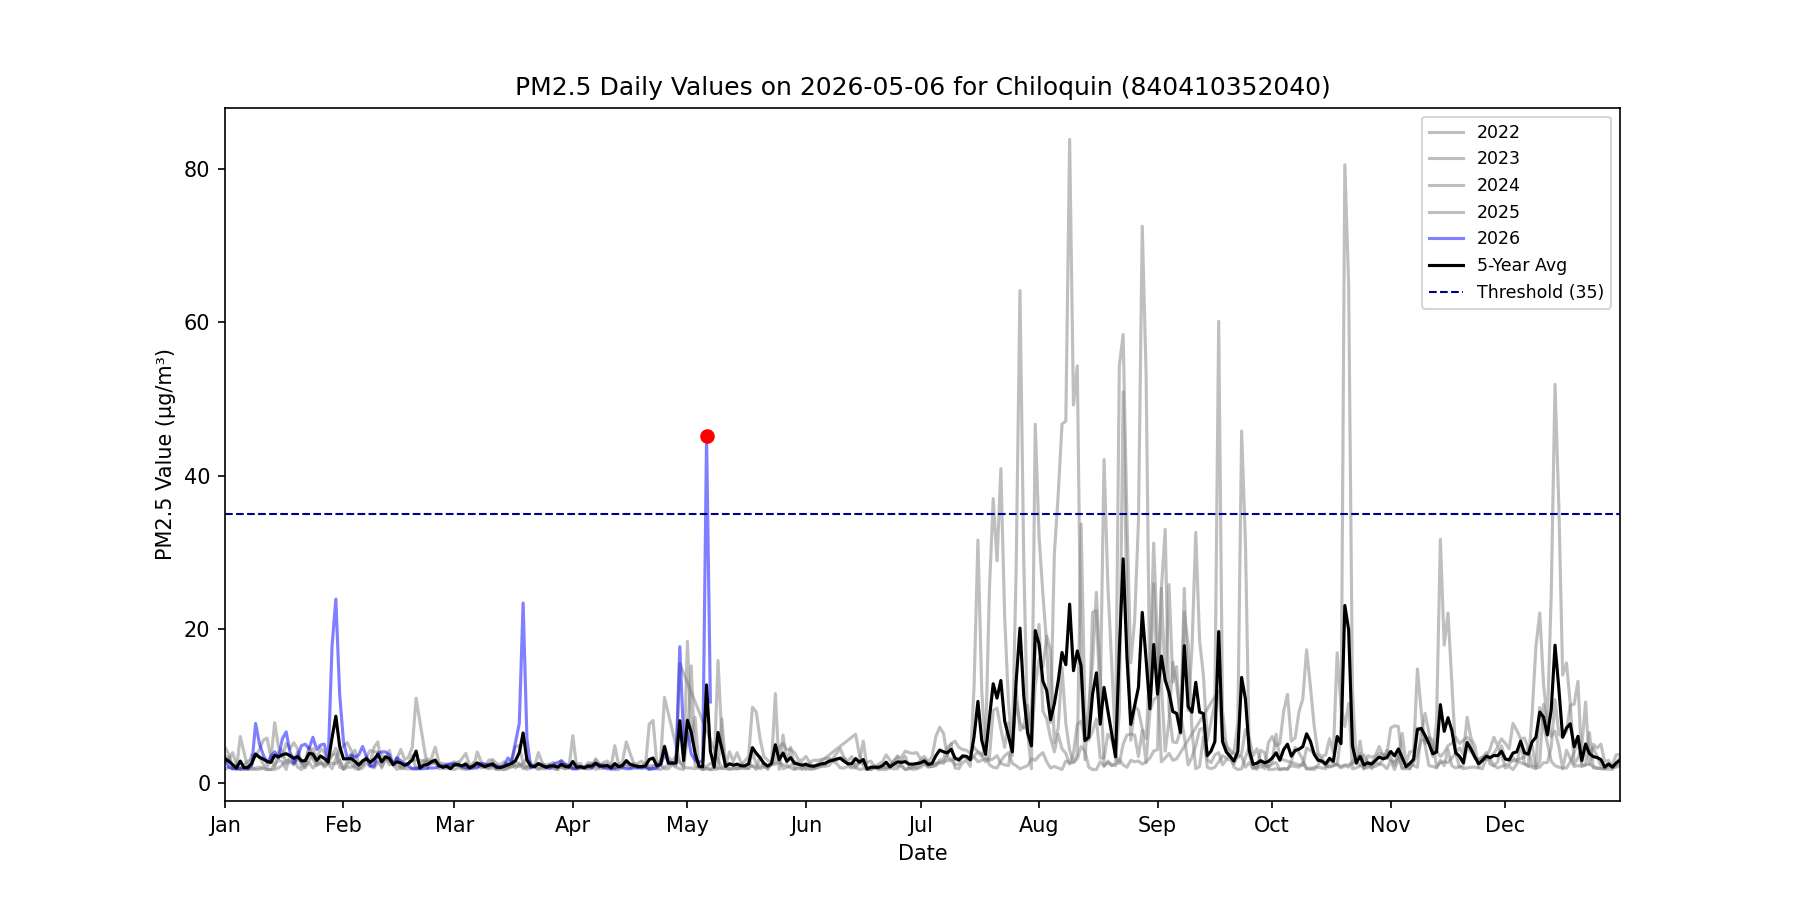
Time series plot of 24-hour PM2.5 concentrations at Chiloquin for each year between 2022 and 2026. The colored dots represent the 24-hour PM2.5 concentrations on May 6, 2026. The black line indicates the 5-year average 24-hour PM2.5 concentration, and the grey dashed line represents the 35 µg/m³ 24-hour PM2.5 standard.
Prescribed Fires within 50 Miles
| Monitor AQS ID | On the Day | One Day Before | Two Days Before |
|---|---|---|---|
| 840410352040 |
|
|
|
Wildfires within 100 Miles
| Monitor AQS ID | 2-Day Range to Exceedance Date |
|---|---|
| 840410352040 |
|
Fire Emission Analysis
| Monitor AQS ID | Emission Analysis |
|---|---|
| 840410352040 | On May 06, 2026, an analysis was conducted to assess the potential impact of nearby fire activity on PM2.5 levels at Chiloquin. 2 wildfires were detected within 100 miles of the site from two days before the event to the event day. The proximity of these fires to the site suggests they may have contributed to elevated PM2.5 levels on this date. The following wildfires were identified: Dutch Fire, which burned 24.00, started on May 05, 2026, and last updated on May 08, 2026. It was located 62.3 miles away. River Fire, which burned 16.00, started on May 05, 2026, and last updated on May 08, 2026. It was located 62.6 miles away. No prescribed fires were identified within 50 miles of Chiloquin. In addition to reported prescribed fire and wildfire records from CAL FIRE and the Prescribed Fire Reporting System (PFIRS), satellite imagery detected 648 fire hotspots over the past two days (from two days before the event to the current day) within 100 miles of the site. This indicates ongoing fire activity in the region, which may have contributed to the observed air quality conditions. However, satellite imagery does not show clear evidence of smoke reaching the monitoring site. This suggests that further analysis is needed to determine whether other factors contributed to the elevated PM2.5 levels. |
HYSPLIT Trajectory for Exceedance Monitor Site
Sorry, the Bluesky smoke analysis image is not available for this fire.